We’ve expanded access to one of Clarity’s most powerful features—Conversion Heatmaps—giving even more users the ability to uncover exactly which parts of their site drive revenue. Whether you run a Shopify store, a custom site, or a large-scale e-commerce platform, this tool is built to help you move past assumptions and into precise, data-backed optimization.
What are Conversion Heatmaps?
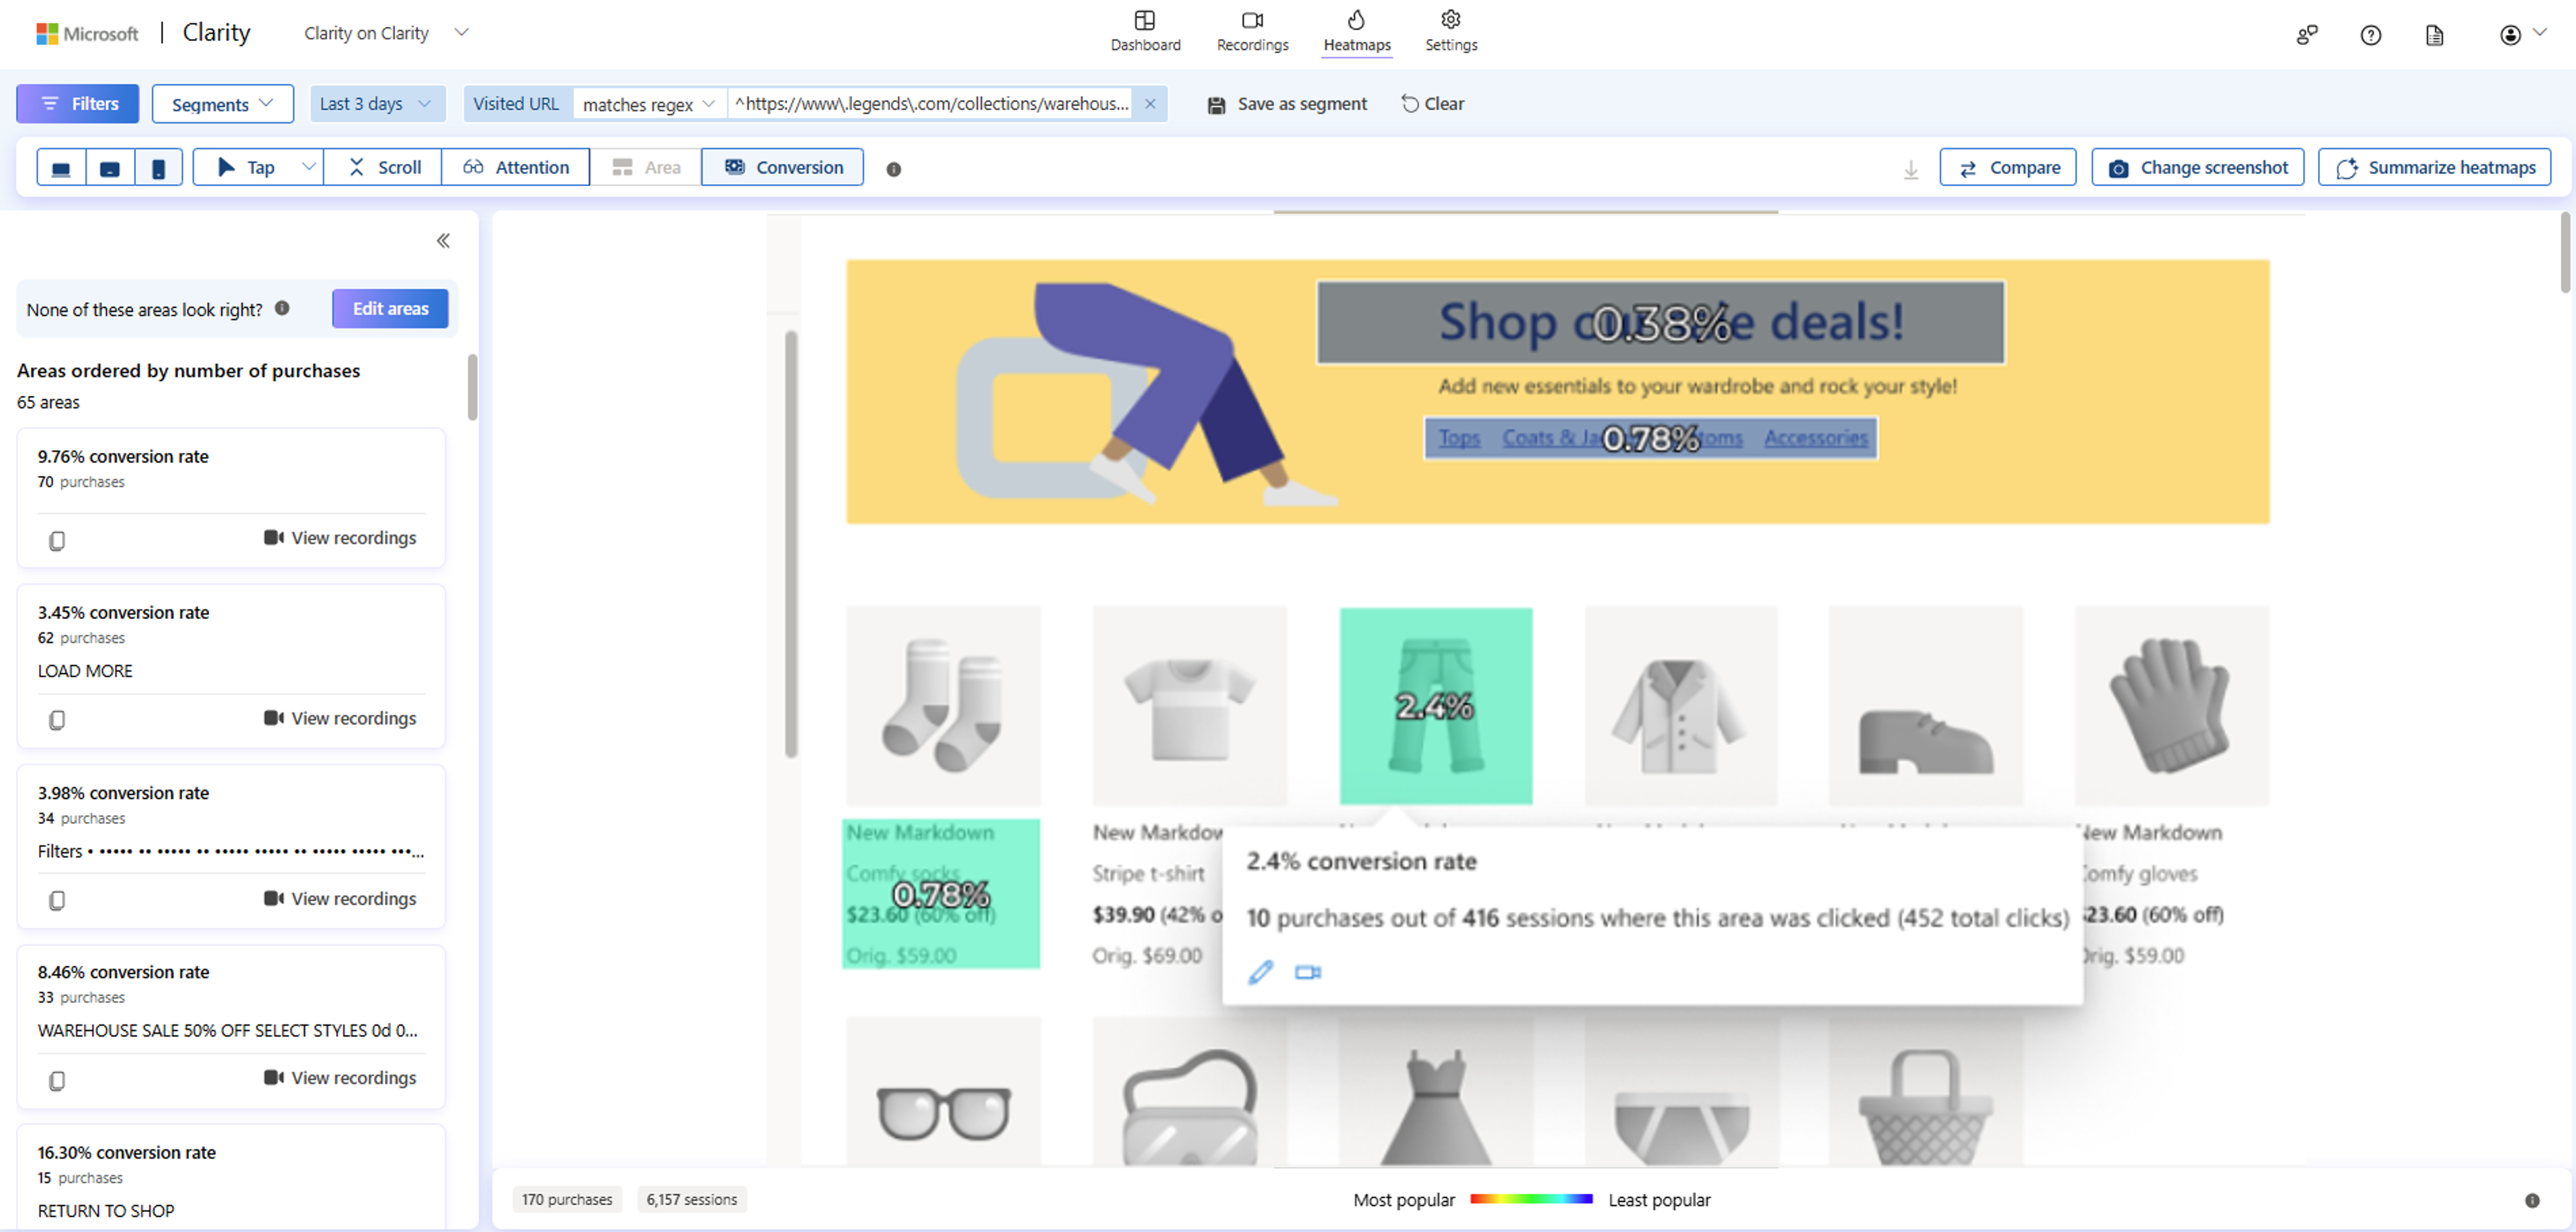
Unlike traditional heatmaps that show where users click, scroll, or move, Conversion Heatmaps reveal which elements directly lead to conversions. You can see, in percentage terms, how likely a user is to purchase after interacting with a specific element on the page.
So, instead of just asking “Where do people click?”, you’re now answering, “What drives sales?”
Example: You might find that a product image has a 2.4% conversion rate—meaning 2.4% of sessions where that element was clicked ended in a purchase. This gives you unprecedented insight into what’s actually working on your site.
How to Access and Use Conversion Heatmaps
Getting started is easy:
- Install Clarity on your site (make sure the tracking code is present on all pages).
- Go to the Heatmaps tab in the Clarity dashboard.
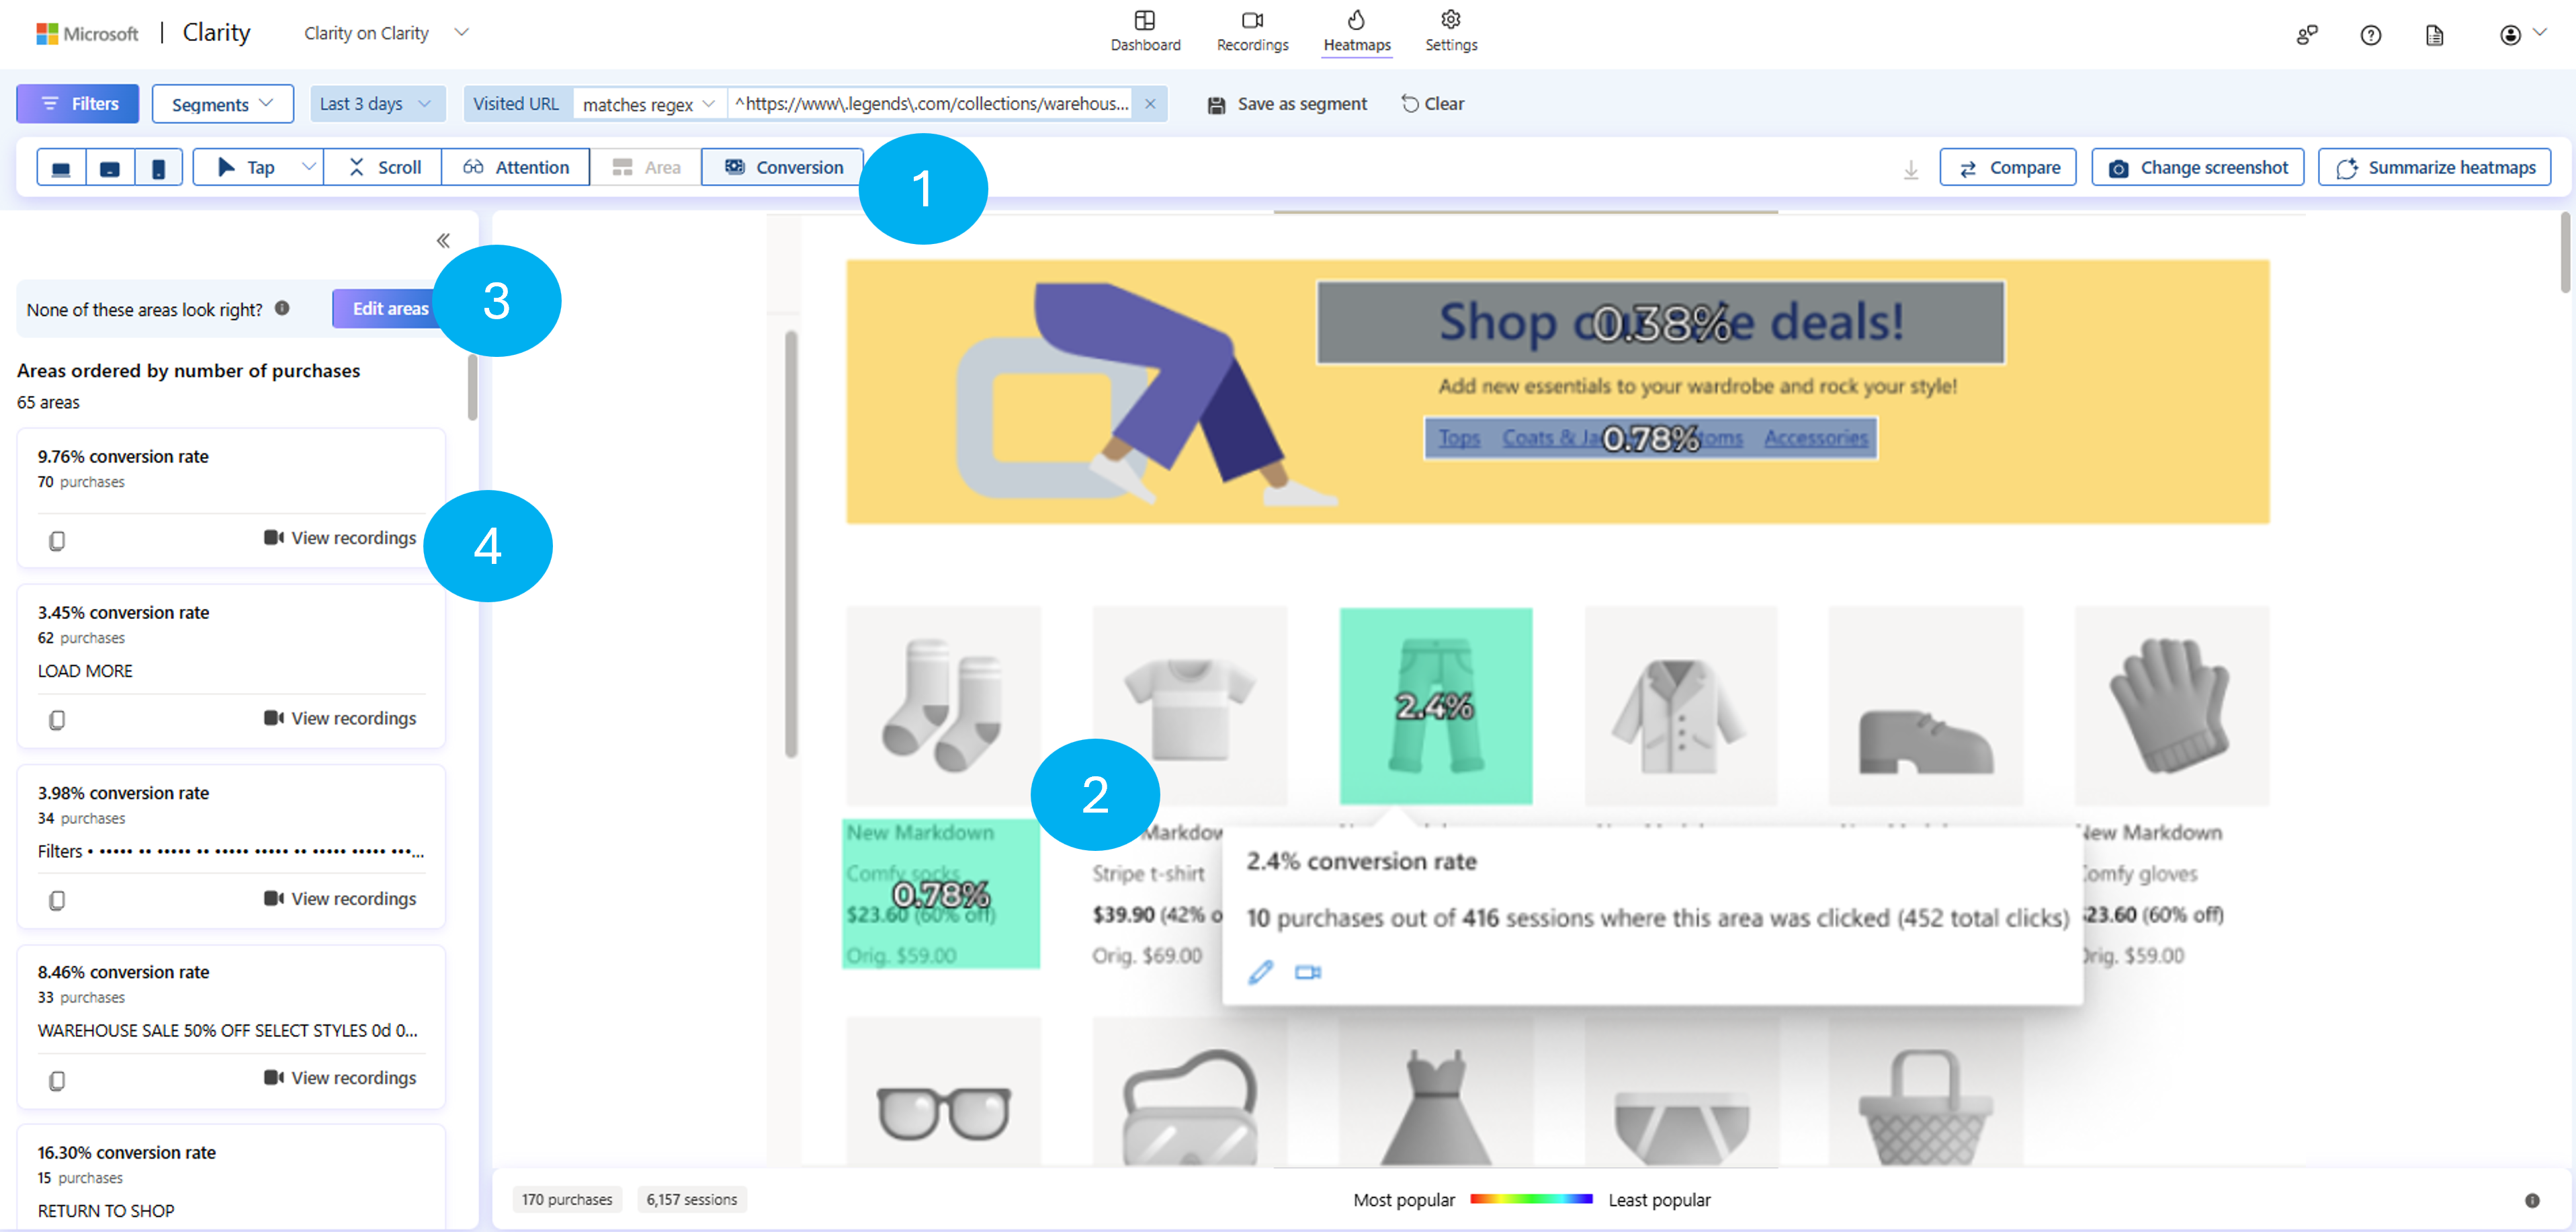
- Select the Conversion Heatmap icon (1) to view purchase conversion data directly on your live page.
Each page view will include:
- Conversion rate overlays (2) (% of sessions that led to purchase after clicking).
- Heatmap visuals showing engagement and purchase value per element.
Note: Conversion data is currently tied to the purchase event. You can configure your setup using clarity(“set”, “conversion”, “true”) to define custom events in Clarity’s API.
Fine-Tune Your Analysis with Edit Mode and Session Recordings
With Edit Areas (3), you can manually define or remove zones on your heatmap. This gives you more precision when evaluating grouped content or custom elements.
And if you’re curious why an element isn’t converting well, tap into “View Recordings” (4) to watch sessions where users interacted with that zone. You’ll get real behavior context—friction points, drop-offs, and unexpected user flows.
Heatmaps + Conversion Heatmaps = Optimization Gold
Use Conversion Heatmaps alongside Click and Scroll Heatmaps to unlock the full picture:
✅ Scenario 1: High Conversion, Low Visibility
You discover a product with a high conversion rate, but your scroll heatmap shows it’s buried far down the page. Solution? Move it above the fold to boost visibility and sales.
🚫 Scenario 2: High Clicks, Low Conversion
Your “Add to Cart” button gets tons of clicks, but leads to few purchases. Combine this with session recordings, and you may find users abandoning due to pricing surprises, login walls, or unclear next steps.
🔎 Scenario 3: Misleading Expectations
Users engage heavily with your site search bar but rarely convert. A review of recordings may show poor search results or unrelated content. Time to improve the algorithm—or tighten your ad targeting.
Recent Updates: Now Available to More Projects
Conversion Heatmaps are now available to a wider set of projects within Clarity. If you haven’t seen them yet, check your dashboard!
For full technical documentation, setup instructions, and API tips, visit our documentation to learn more
Final Thoughts
Conversion Heatmaps let you go beyond vanity metrics and into real business impact. Whether you’re tweaking CTA placements or rethinking page structure, this tool shows you what works—and what’s holding you back.
Ready to make smarter decisions with Microsoft Clarity? Activate Conversion Heatmaps and start driving measurable growth.