
How Kalicube Increased Active Time on Page +47%
Using Microsoft Clarity, Kalicube received insights into how its audience interacts with long-form content. An analysis of the case studies section of the Kalicube.com site allowed for the optimization of four critical metrics and ultimately improving their bottom line by driving more qualified leads:
- Time on page +16%
- Active time on page +47%
- Quick backs -71%
- Dead Clicks -41%
What is Kalicube?
Kalicube is a digital marketing agency founded in 2015 to pioneer the concept of Brand SERP optimization and Knowledge Panel management. Jason Barnard (pictured below) is the founder of Kalicube, and has more than two decades of experience in digital marketing.
He started in the year Google was incorporated with a website for children based on the characters Boowa & Kwala, which he built up to become one of the 10,000 most visited sites in the world.founded in 2015 to pioneer the concept of Brand SERP optimization and Knowledge Panel management.
Jason Barnard (pictured below) is the founder of Kalicube, and has more than two decades of experience in digital marketing. He started in the year Google was incorporated with a website for children based on the characters Boowa & Kwala, which he built up to become one of the 10,000 most visited sites in the world.


Kalicube Wanted to Increase User Engagement and On-Page Time
Kalicube provides content that is truly helpful to their audience but struggled to understand why visitors weren’t engaging. Like most sites, Kalicube.com uses Google Analytics, which shows bounce rate and session duration….But never told them how the audience interacted with the content.
Kalicube.com wanted to make their content more “sticky”, which means ensuring that the content is present in a way that helps the audience consume it and make the best use of it. That is where Microsoft Clarity was a HUGE help.
Getting insights into how the audience interacts with the pages is a massive help in improving the user experience. But first, they needed to determine which section of the website to focus on first.
The Kalicube Case Study Section Is the Most Popular
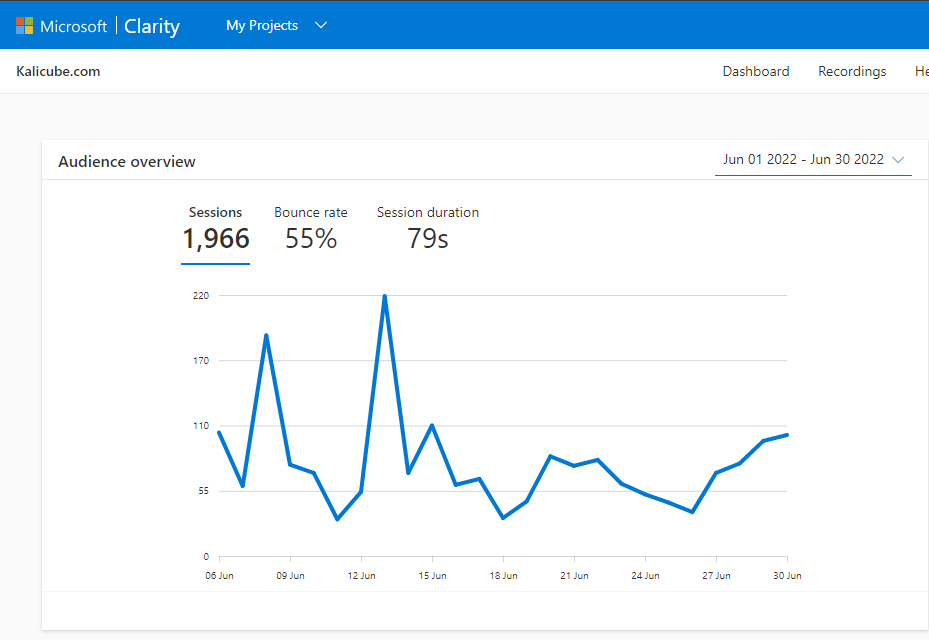
A quick glance at the Microsoft Clarity dashboard showed that the case studies section is the most popular. The next step was to look at the recordings and heatmaps to see how visitors behave on these important pages. This allowed for optimization to increase engagement and identify topics that drive engagement instead of just traffic.
The huge question that Kalicube wanted to answer with Microsoft Clarity is, “how can we better engage our core audience with a page design that better retains their attention”
Adding the Table of Contents
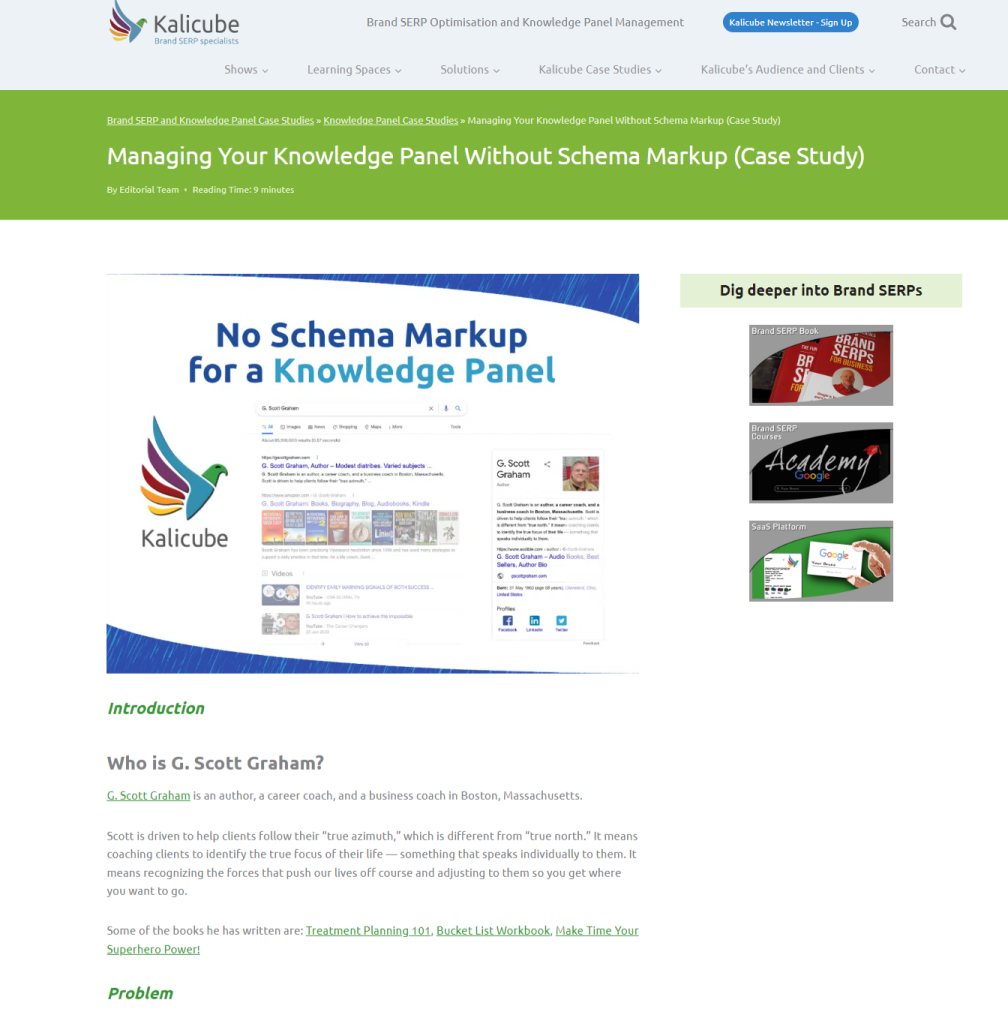
Without a table of contents, the user was immediately presented with the introduction. Clarity showed that they tended to scroll, skim the article, and leave the page.
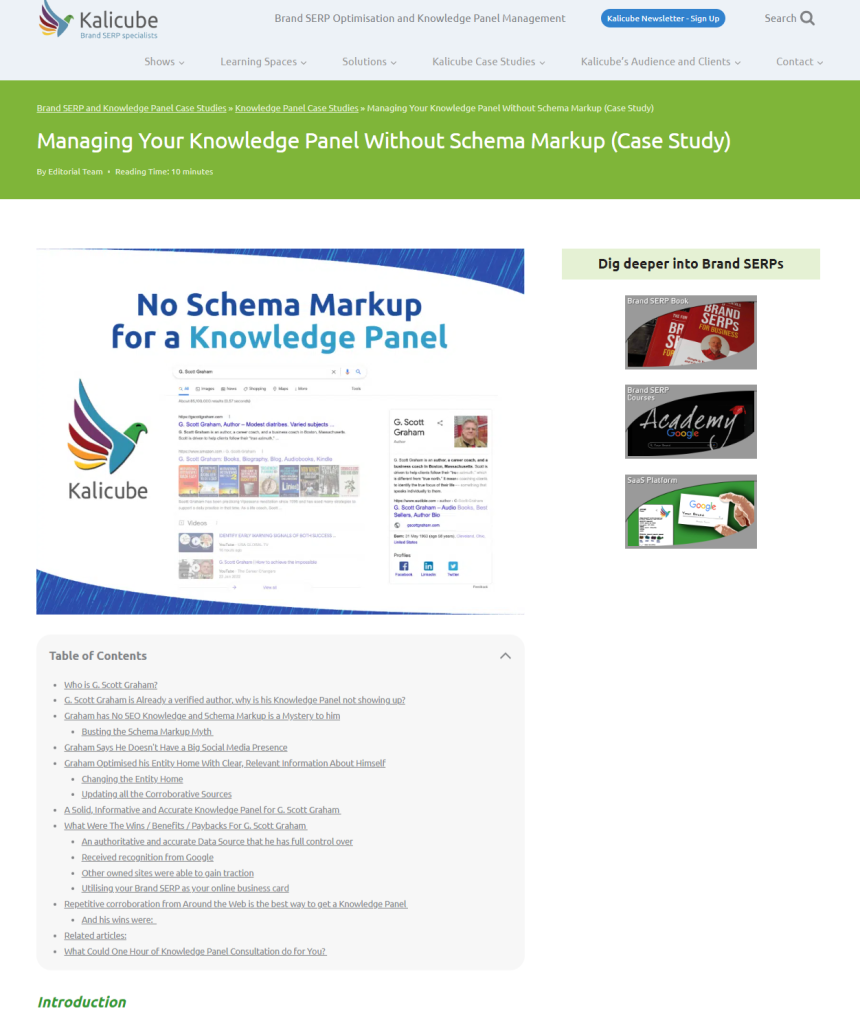
Kalicube added a table of contents at the top of the page. After analyzing the site visitors’ behavior, they understood that they were incredibly important to their users.
When comparing the before and after on Microsoft Clarity, it became clear that a table of contents helped the users see which parts of the case study interest them at a glance. The Kalicube team could clearly see that the Table of Contents reduced quick backs, improved readability, increased active time on the page, and generally kept the core audience significantly more engaged.
Turning Dead Clicks Into Pull Quotes
“Dead clicks” is a term Kalicube hadn’t heard of before. Simply put, they are clicks on a page that do not initiate a change or action. People often make “dead clicks” when misled into thinking that an element on the page will trigger a change or action. That wasn’t the issue here, however.
What Kalicube saw in their case studies was that site visitors clicked and selected the text they were reading. It might be surprising that people do this (we certainly didn’t expect this behavior), but it showed which parts they find really insightful.
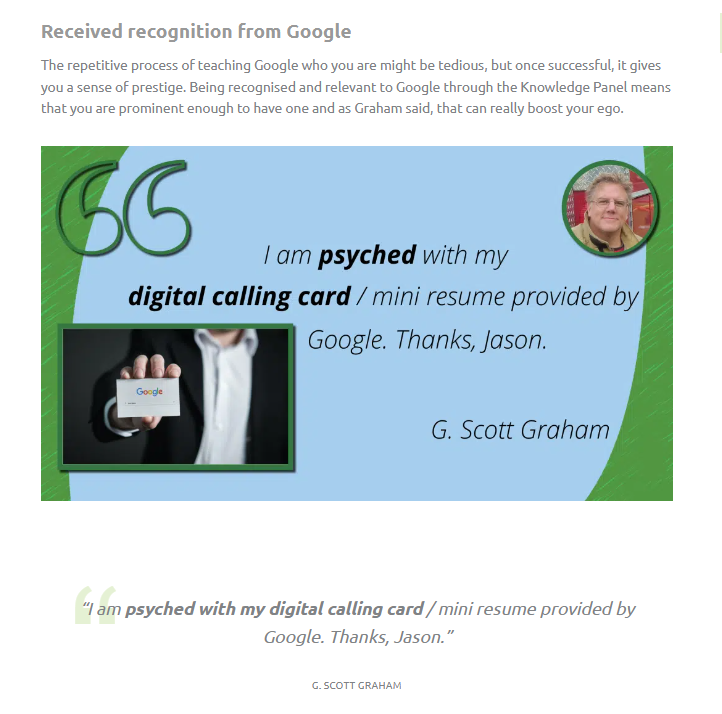
This gave Kalicube the idea to extract these dead-click selected texts as pull quotes within the content, making it easier for time-sensitive visitors to get the message:
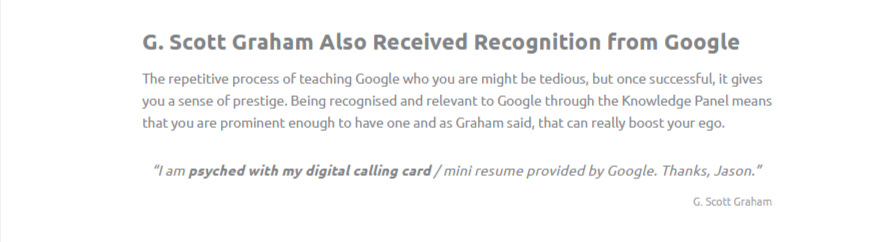
And then took that a step further and made shareable visuals, which led to a noticeable uptick in social media activity around the case studies:
Positive Results After Two Months
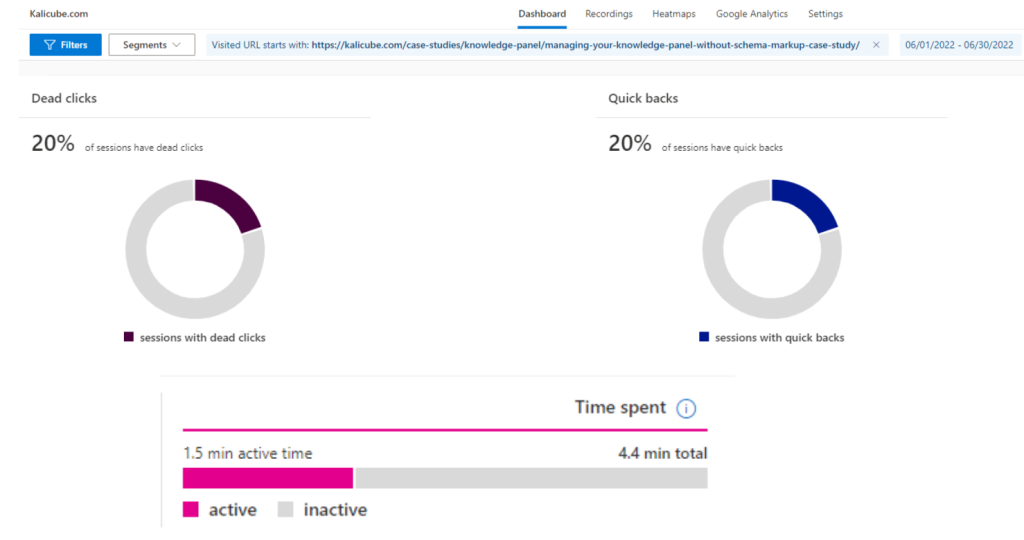
The data received from Clarity in June shows that visitors on the site spend a total of 1.5 minutes actively engaging with the case studies and 4.4 minutes on the page… and that there had been 20% dead clicks and 20% quick backs (where site visitor immediately returns to the previous page after seeing our case study page).
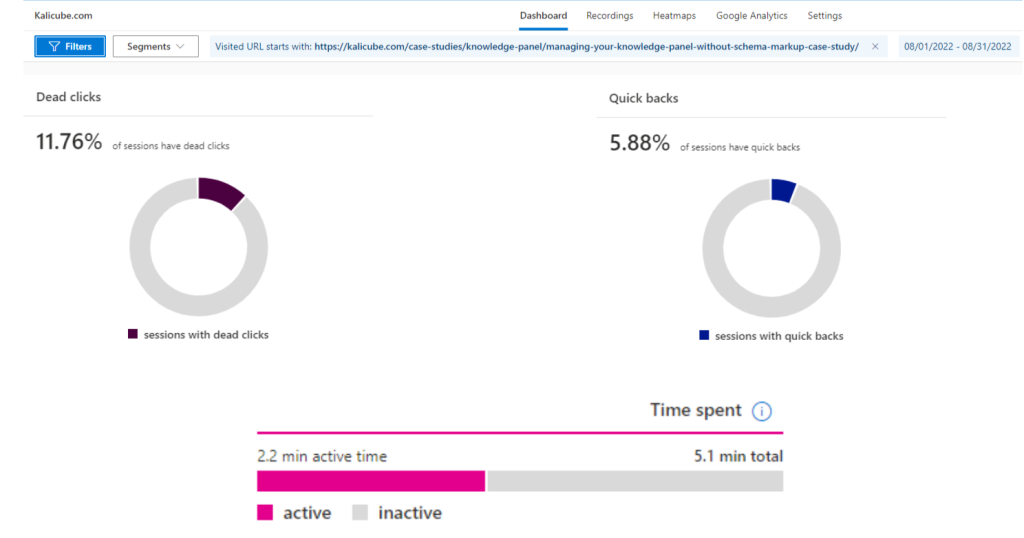
Kalicube made several iterations of changes using the data from Microsoft Clarity to guide them. The results were incredibly positive. The time spent on the page increased from 4.4 minutes to 5.1 minutes, but more importantly, the active time increased by almost 50%.
Even better, quick backs dropped four-fold, suggesting that the table of contents helped the core audience understand what the case study offers.
Dead clicks dropped almost 50%. Using pull-quotes made the content more easily digestible by proactively highlighting the essential parts.
User Engagement isn’t a Vanity Metric. Far From it.
You are driving your bottom line when you can help your core audience better engage with your bottom-of-funnel content. At Kalicube, they saw that the improved user experience had significantly increased the number of qualified leads they received from the case study pages. Not only did they have more inquiries for their services, but they also saw that the people who contacted them better understood what they could offer.
Increasing bottom-of-funnel audience engagement and focus has been a HUGE win for Kalicube.
The actual changes we needed to make to get that “win” seem oh-so-obvious now. Without Microsoft Clarity, we never would have known.
Microsoft Clarity provided the data that allowed us to vastly improve the user experience for our core audience, which has directly improved the bottom line of Kalicube’s business. The detailed charts have helped us to better visualise the positive impact, report on the improvements and justify the investment in enhancing this part of the site.
Kalicube