Understanding user behavior is critical for optimizing your website’s performance. Microsoft Clarity’s new Attention Maps feature offers a fresh perspective on how visitors interact with your pages, helping you fine-tune your user experience and maximize engagement.
What Are Attention Maps?
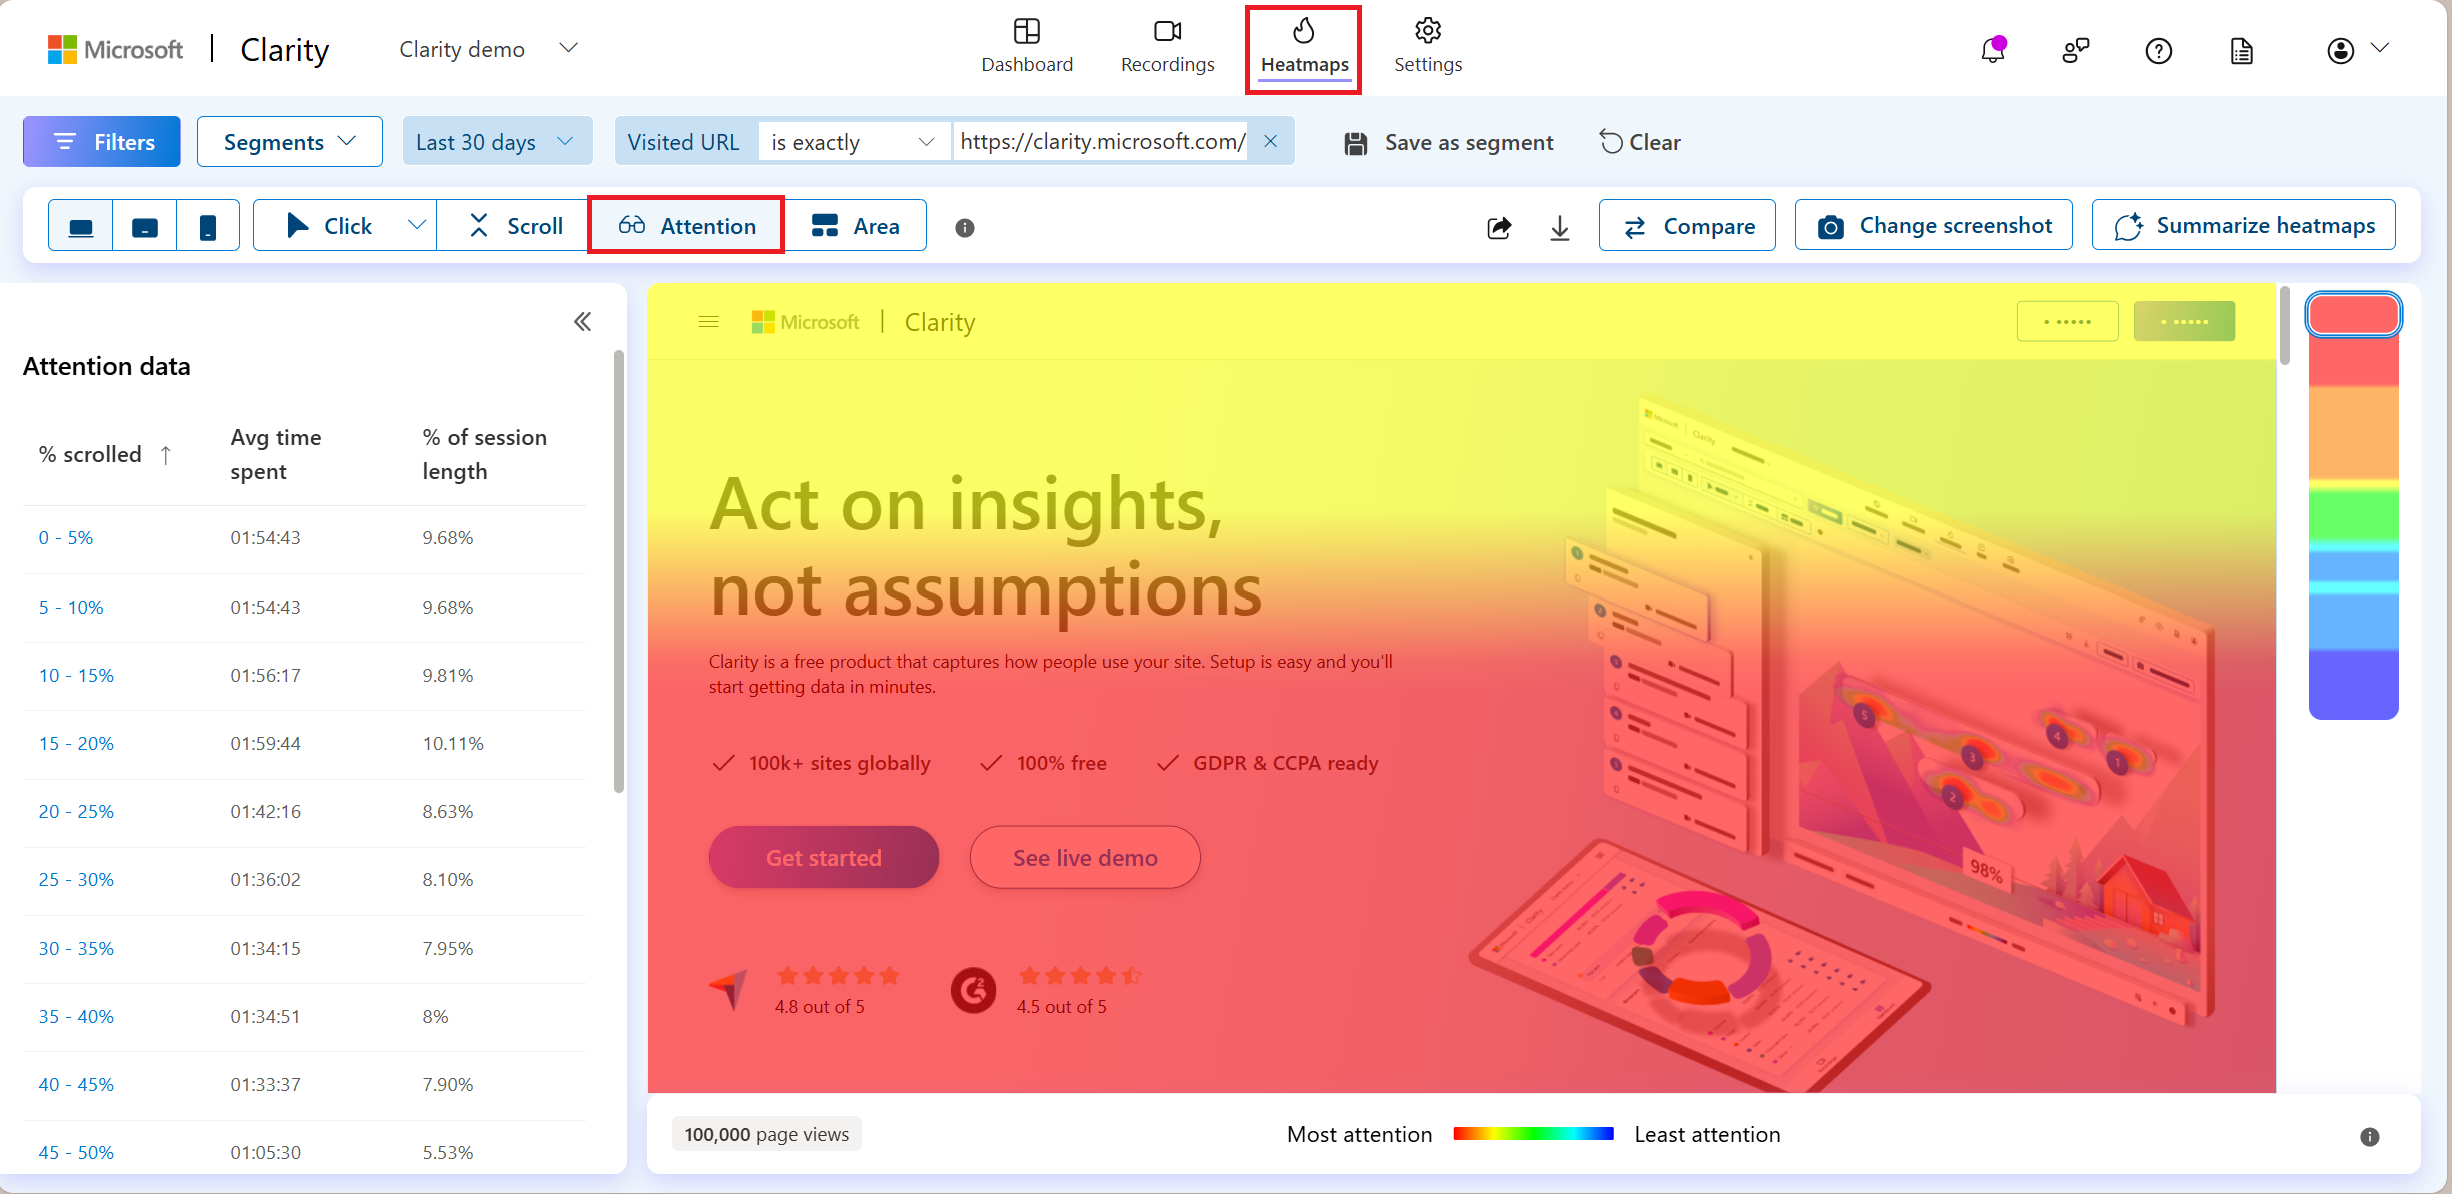
Attention Maps visualize where users spend the most time on your webpage. By highlighting sections with warmer or cooler colors, they reveal which parts of your content captivate your audience’s attention and which areas may need improvement. This granular insight helps you answer key questions like:
- Are users engaging with the most important elements on your page?
- Are visitors missing critical CTAs or information?
These insights empower data-driven decisions, from tweaking content placement to refining page layouts.

Key Features of Attention Maps
Attention Maps provide detailed metrics that bring clarity to user engagement patterns:
- Average Time Spent: Measure the average time users spend on specific parts of your page. Hover over any section to get precise data.
- Percentage of Session Length: Understand how long users focus on a section relative to the overall session length.
- Heatmap Visualization: Warmer colors indicate more time spent, while cooler colors show areas with less time spent.

How to Use Attention Maps
- Install the Clarity Tracking Code: Ensure the Clarity tracking code is installed on the pages you want to analyze. Follow the Setup Process for step-by-step guidance.
- Access Attention Maps: Navigate to the Heatmaps section in your Clarity dashboard and select Attention Maps. Use the left-hand panel to explore data such as:
- % Scrolled: View page sections based on scroll depth.
- Avg Time Spent: Identify areas where users spend the most time.
- % of Session Length: Assess user focus relative to the total session.
- Analyze and Optimize:
- Focus on sections with cooler colors to improve visibility or time spent.
- Test layout changes to direct attention toward high-priority elements like CTAs or key content.
Why Use Attention Maps?
Whether you’re optimizing an e-commerce product page, refining your blog layout, or improving form submissions, Attention Maps provide actionable insights to:
- Enhance page usability
- Boost conversions
- Drive better outcomes for your business
Enhance Your Understanding with Clarity’s Heatmaps
Attention Maps are part of Clarity’s robust Heatmap suite, which also includes Click Maps and Scroll Maps. Together, these tools offer a comprehensive view of user interaction, enabling you to craft experiences that resonate with your audience.
Get Started Today
Ready to uncover what truly holds your audience’s attention? Sign in to your Microsoft Clarity account and explore Attention Maps now. For more tips on maximizing your insights, check out our Heatmap FAQ and Heatmaps Overview.
