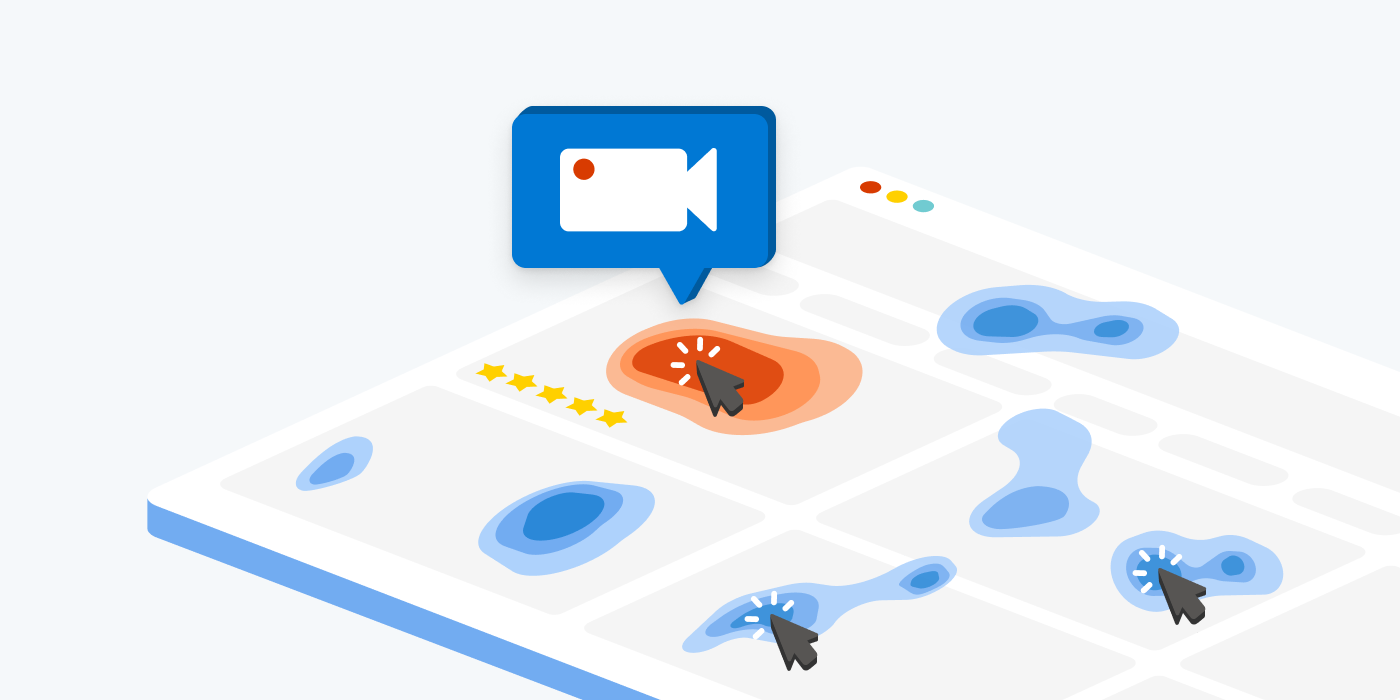
Heat maps or Heatmaps are a great way for you to analyze aggregated information on users’ interactions with your website. At a glance, you can quickly see which elements on your site are the most engaged and which aren’t.
Our customers love our instant heat maps but wanted an uncomplicated solution to watch how users interacted with their webpage elements.
Well, our awesome team heard you loud and clear! Therefore, you can now quickly watch session recordings for elements of interest directly from your Heat map vertical- RESULT!
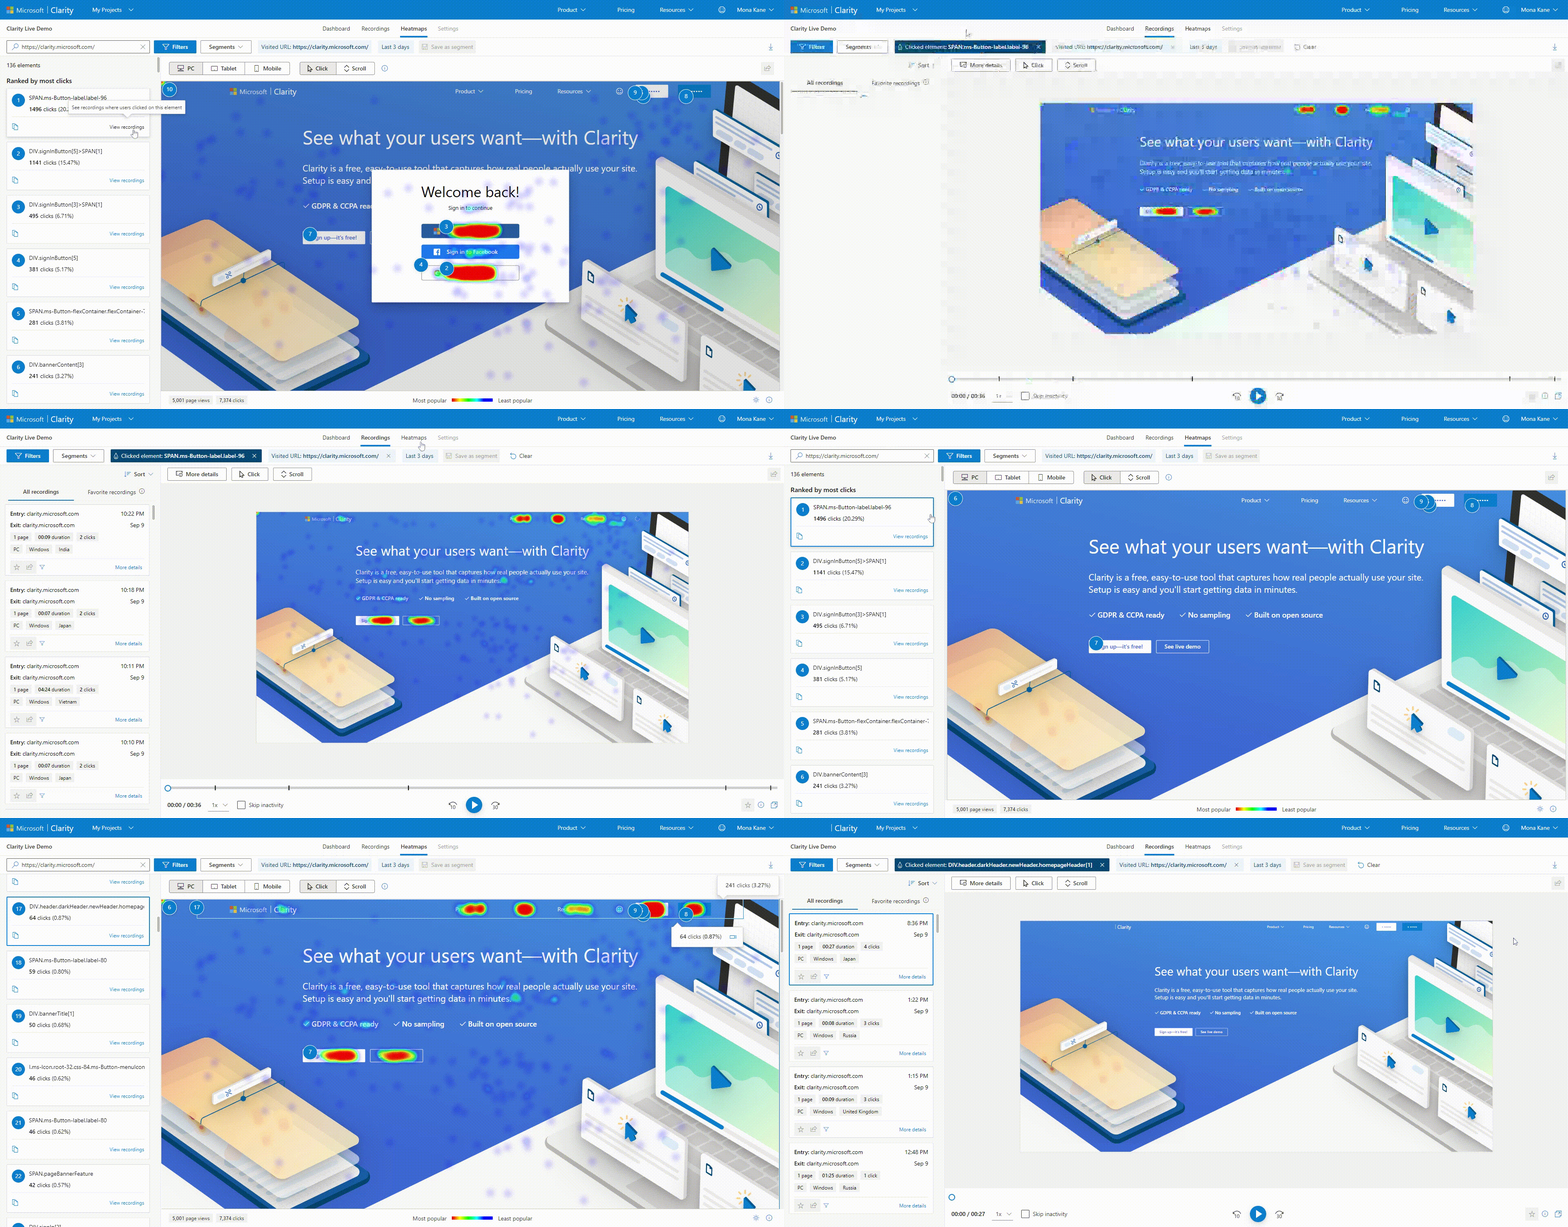
For example, a user is looking at a click heatmap and is interested in why a button has lots of clicks. This new feature helps the user by filtering recordings related to the button. Furthermore, the user can understand what happened before the click interaction.
Watch heat maps connected to session recording in action:

The above example showcases this new functionality: the ability to filter recordings for a specific page element that had click engagement.
The left panel shows the webpage elements ranked by the number of clicks. By selecting a clicked element, you can see the number of clicks. To watch the recording related to that element click ‘View recordings’ or by selecting the 🎥 icon on a clicked element – EASY!
NOTE: If you’d like to watch all sessions related to your heat map, just go to Recordings vertical from Heatmap. Our filters are sticky and they will show you all users that contributed to the heat seen!
See it in action via the Clarity Live demo!
Read more about the awesomeness of Clarity on our Blog page.
