In the field of data analytics, obtaining insights and facilitating strategic decision-making depend on the integration of many tools and platforms. The Data Export API is a robust feature that Microsoft Clarity just released that enables users to export dashboard data programmatically. Here we will explain how to improve your data visualization and analysis by integrating Power BI.
Why Integrate Microsoft Clarity with Power BI?
Data analysts and marketers have access to a multitude of new opportunities with Power BI’s integration of Microsoft Clarity’s Data Export API. Rich behavior-based analytics data from Clarity can be fed into Power BI to enable the creation of more dynamic dashboards, reports, and data visualizations. Deeper insights into user behavior on your website are made possible by this symbiosis, which empowers data-driven decision-making to maximize user experience and conversion rates.
Setting the Stage: Generating API Access Tokens
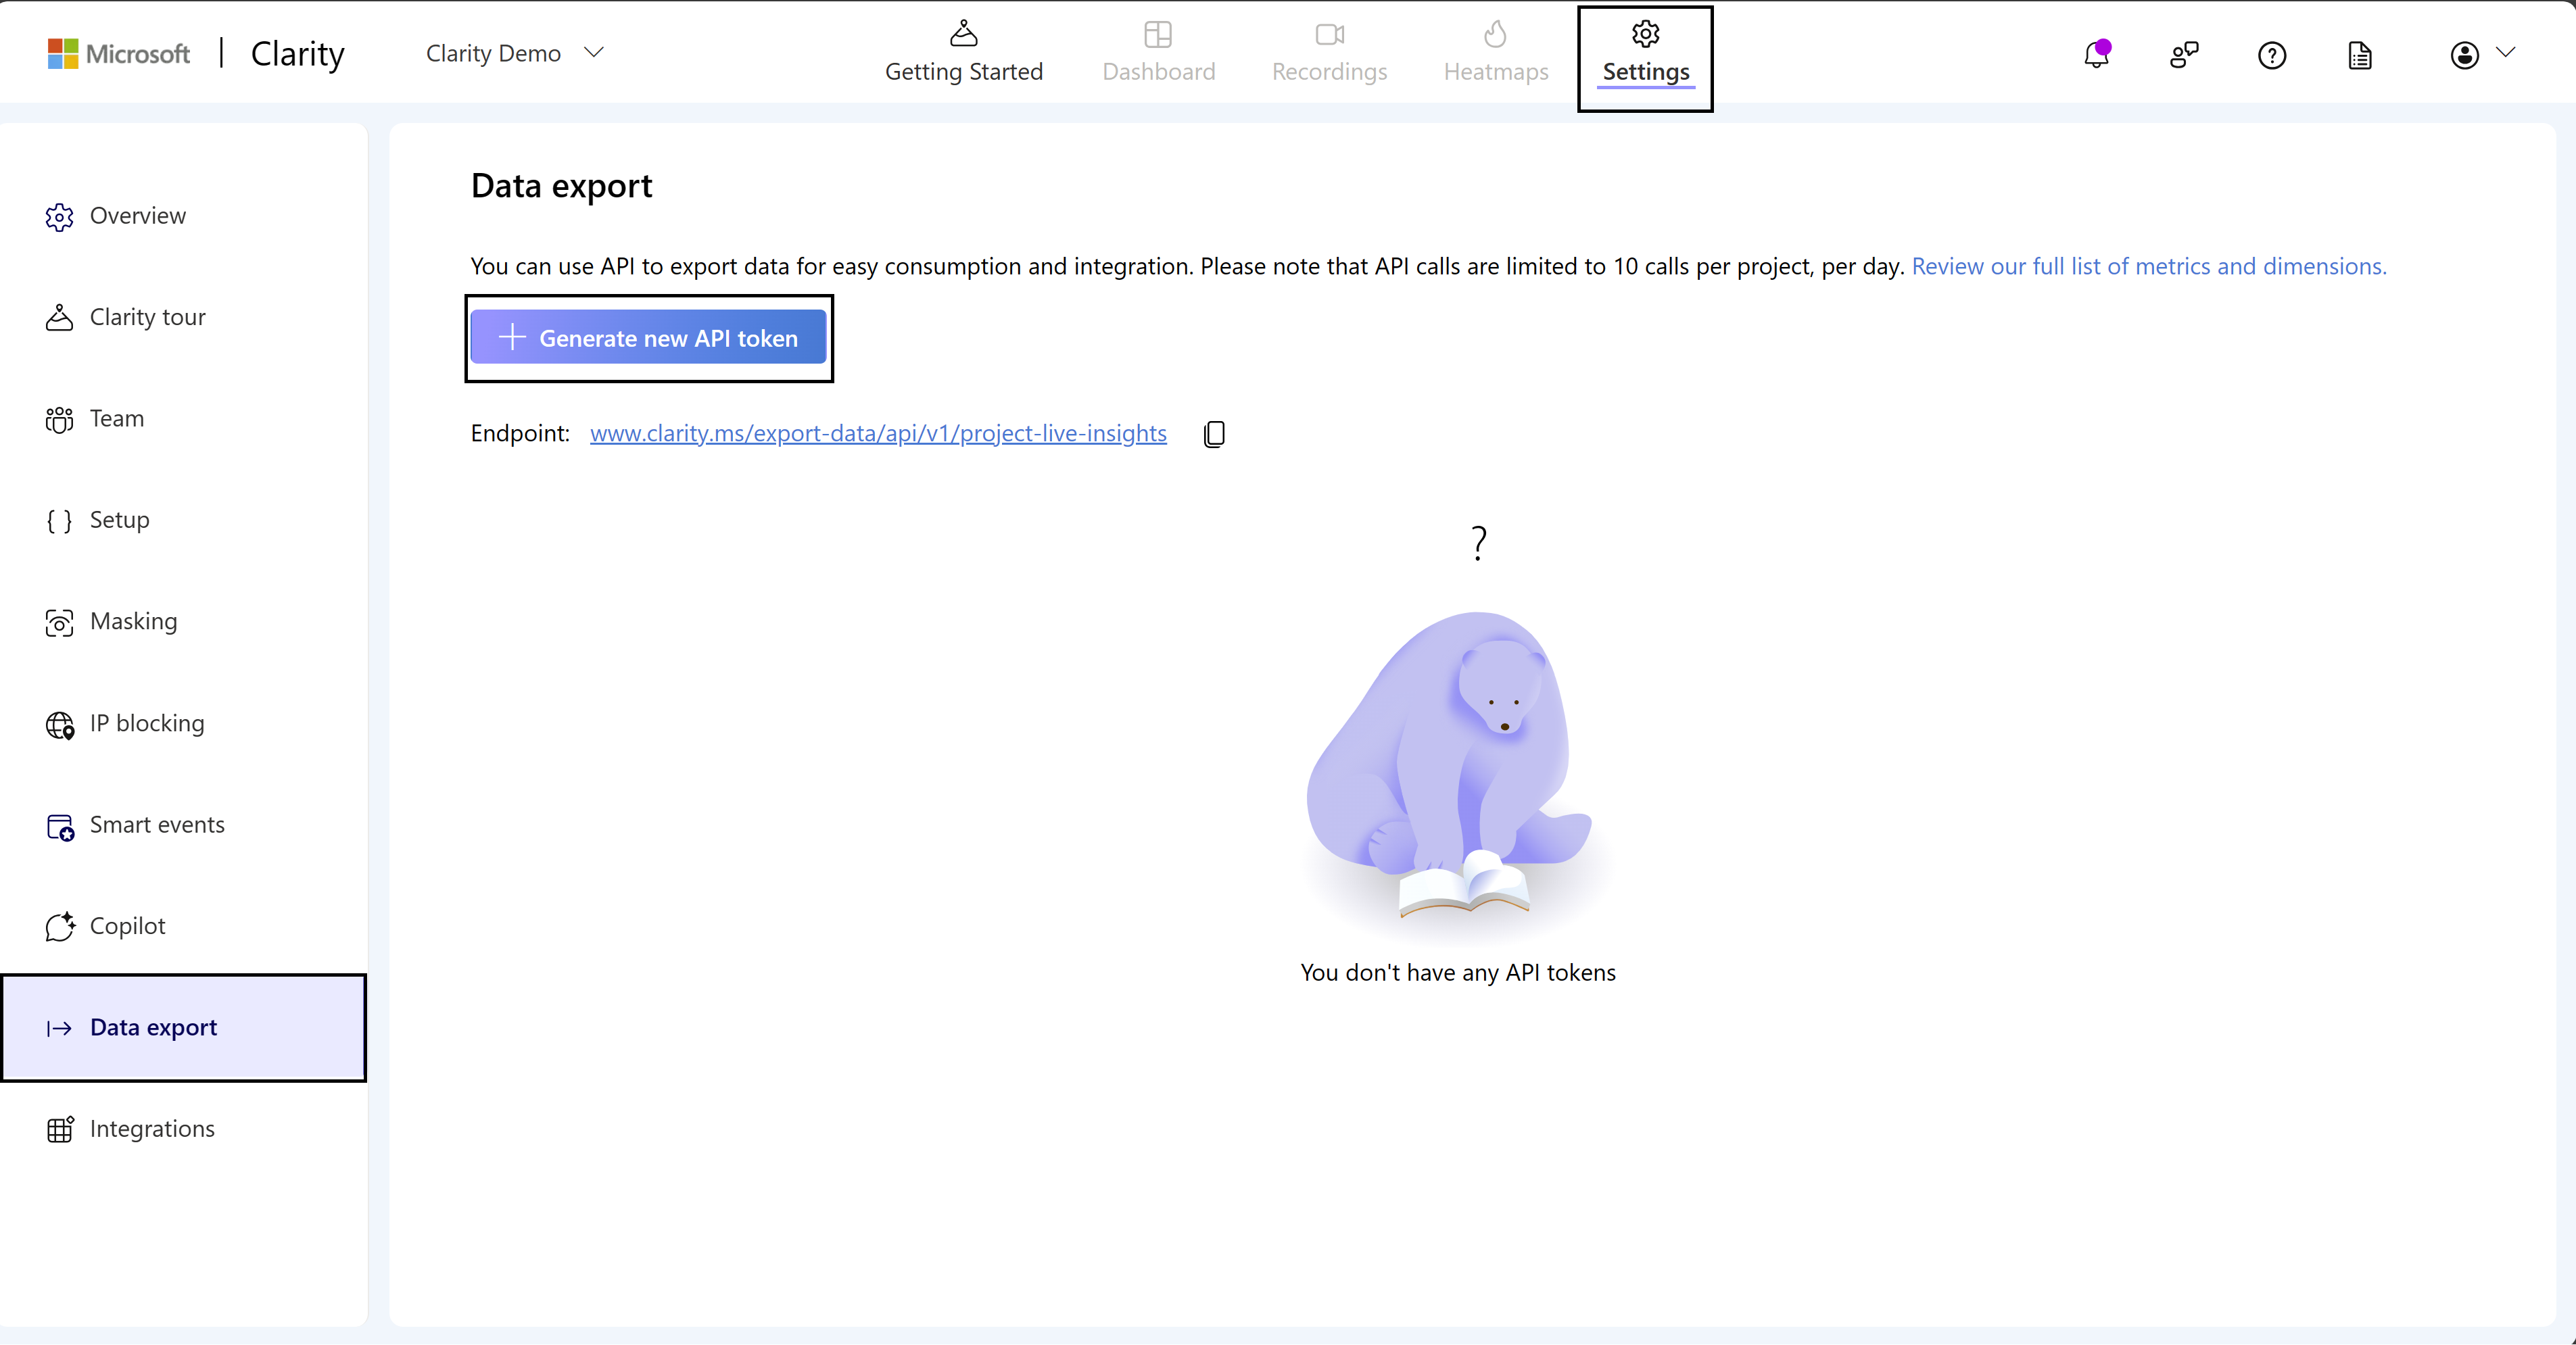
Before diving into Power BI, the first step is to generate an API access token in Microsoft Clarity. This token is essential for authenticating your data requests from Clarity to Power BI.
- Log in to your Microsoft Clarity account.
- Navigate to the settings and locate the Data Export section.
- Generate a new API token, and store it securely – you’ll need it soon.

Connecting Microsoft Clarity to Power BI
With your API token in hand, you’re ready to connect Clarity to Power BI:
- Open Power BI Desktop: Begin by launching Power BI Desktop. If you don’t have it installed, it’s available for free from the Microsoft Store.
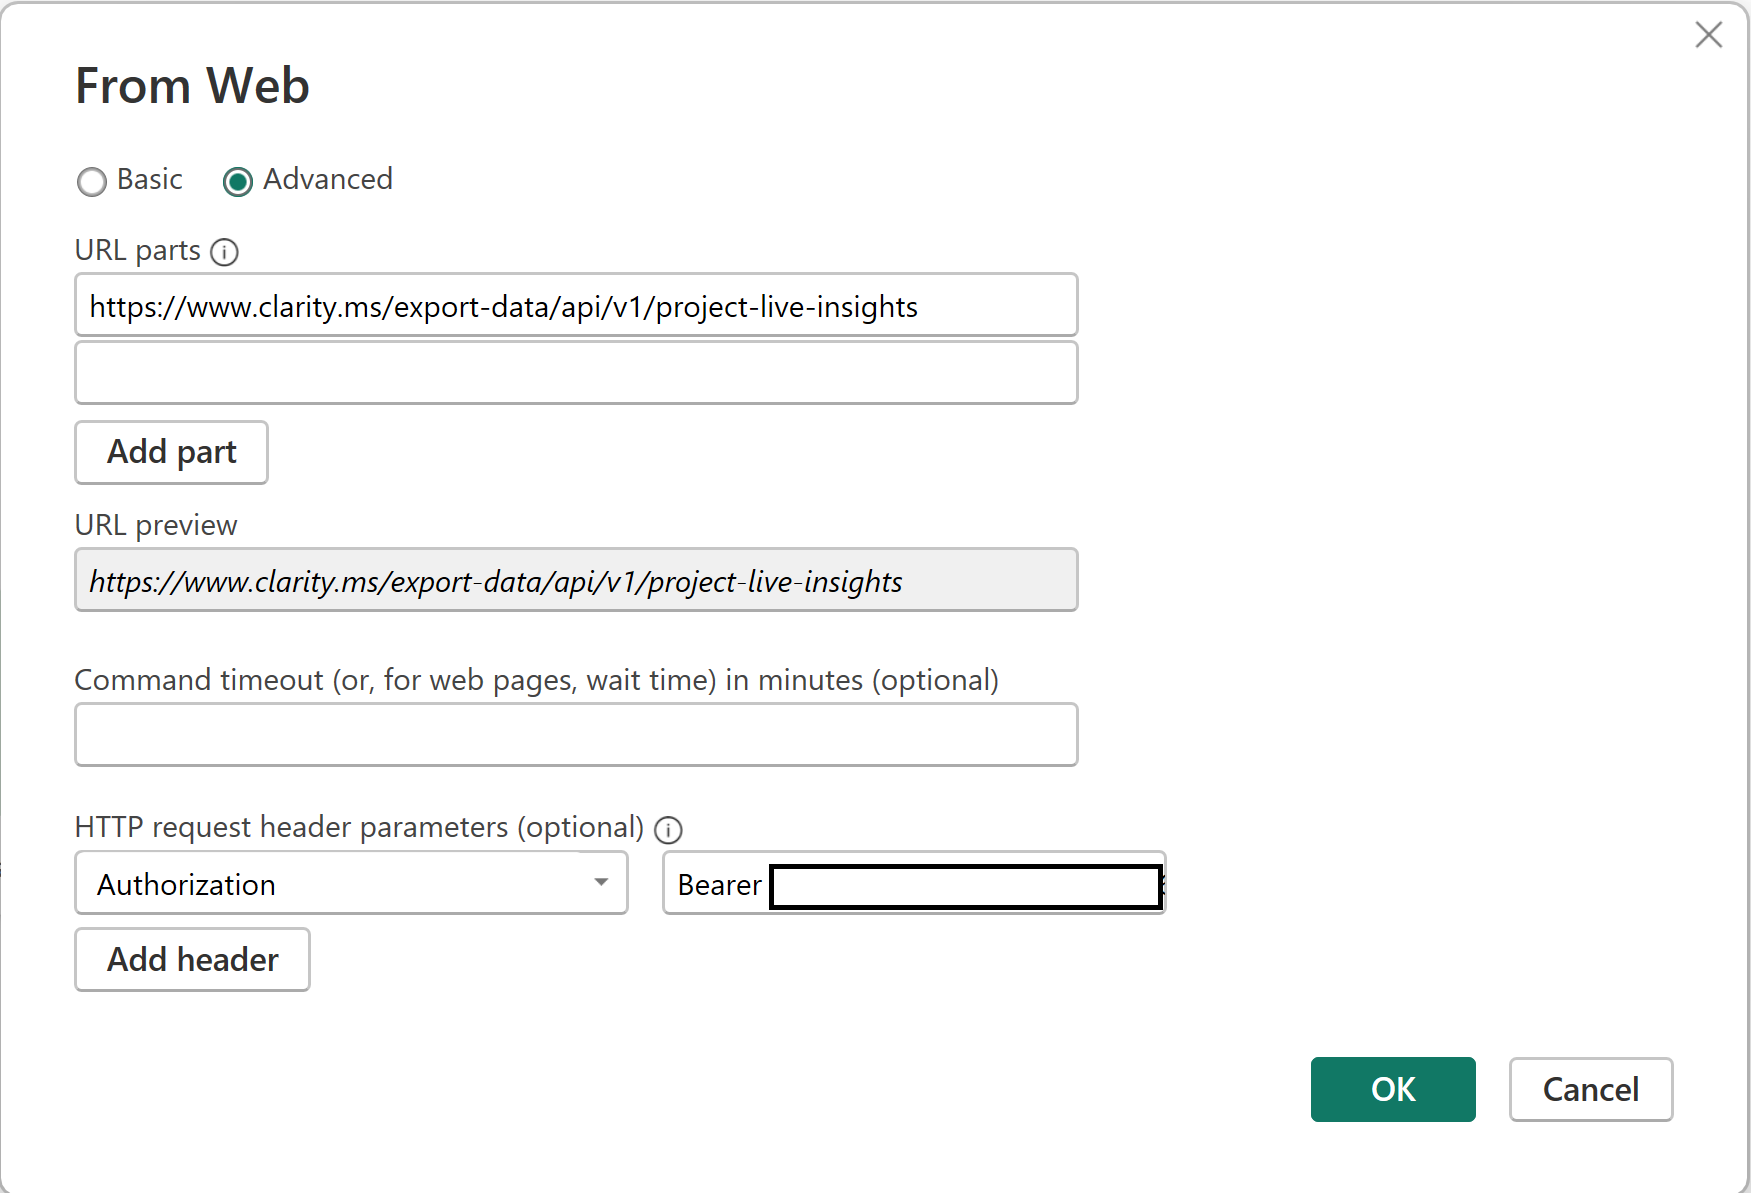
- Get Data from the Clarity API: Go to the ‘Home’ tab and click on ‘Get Data’. Choose the ‘Web’ option as your data source.
- Enter the API Endpoint and Headers: In the URL field, input the endpoint URL of the Microsoft Clarity Data Export API. Then, use the ‘Advanced’ option to specify the HTTP request header parameters. Add a header with the key Authorization and the value Bearer YOUR_API_TOKEN.

Transforming the JSON Data
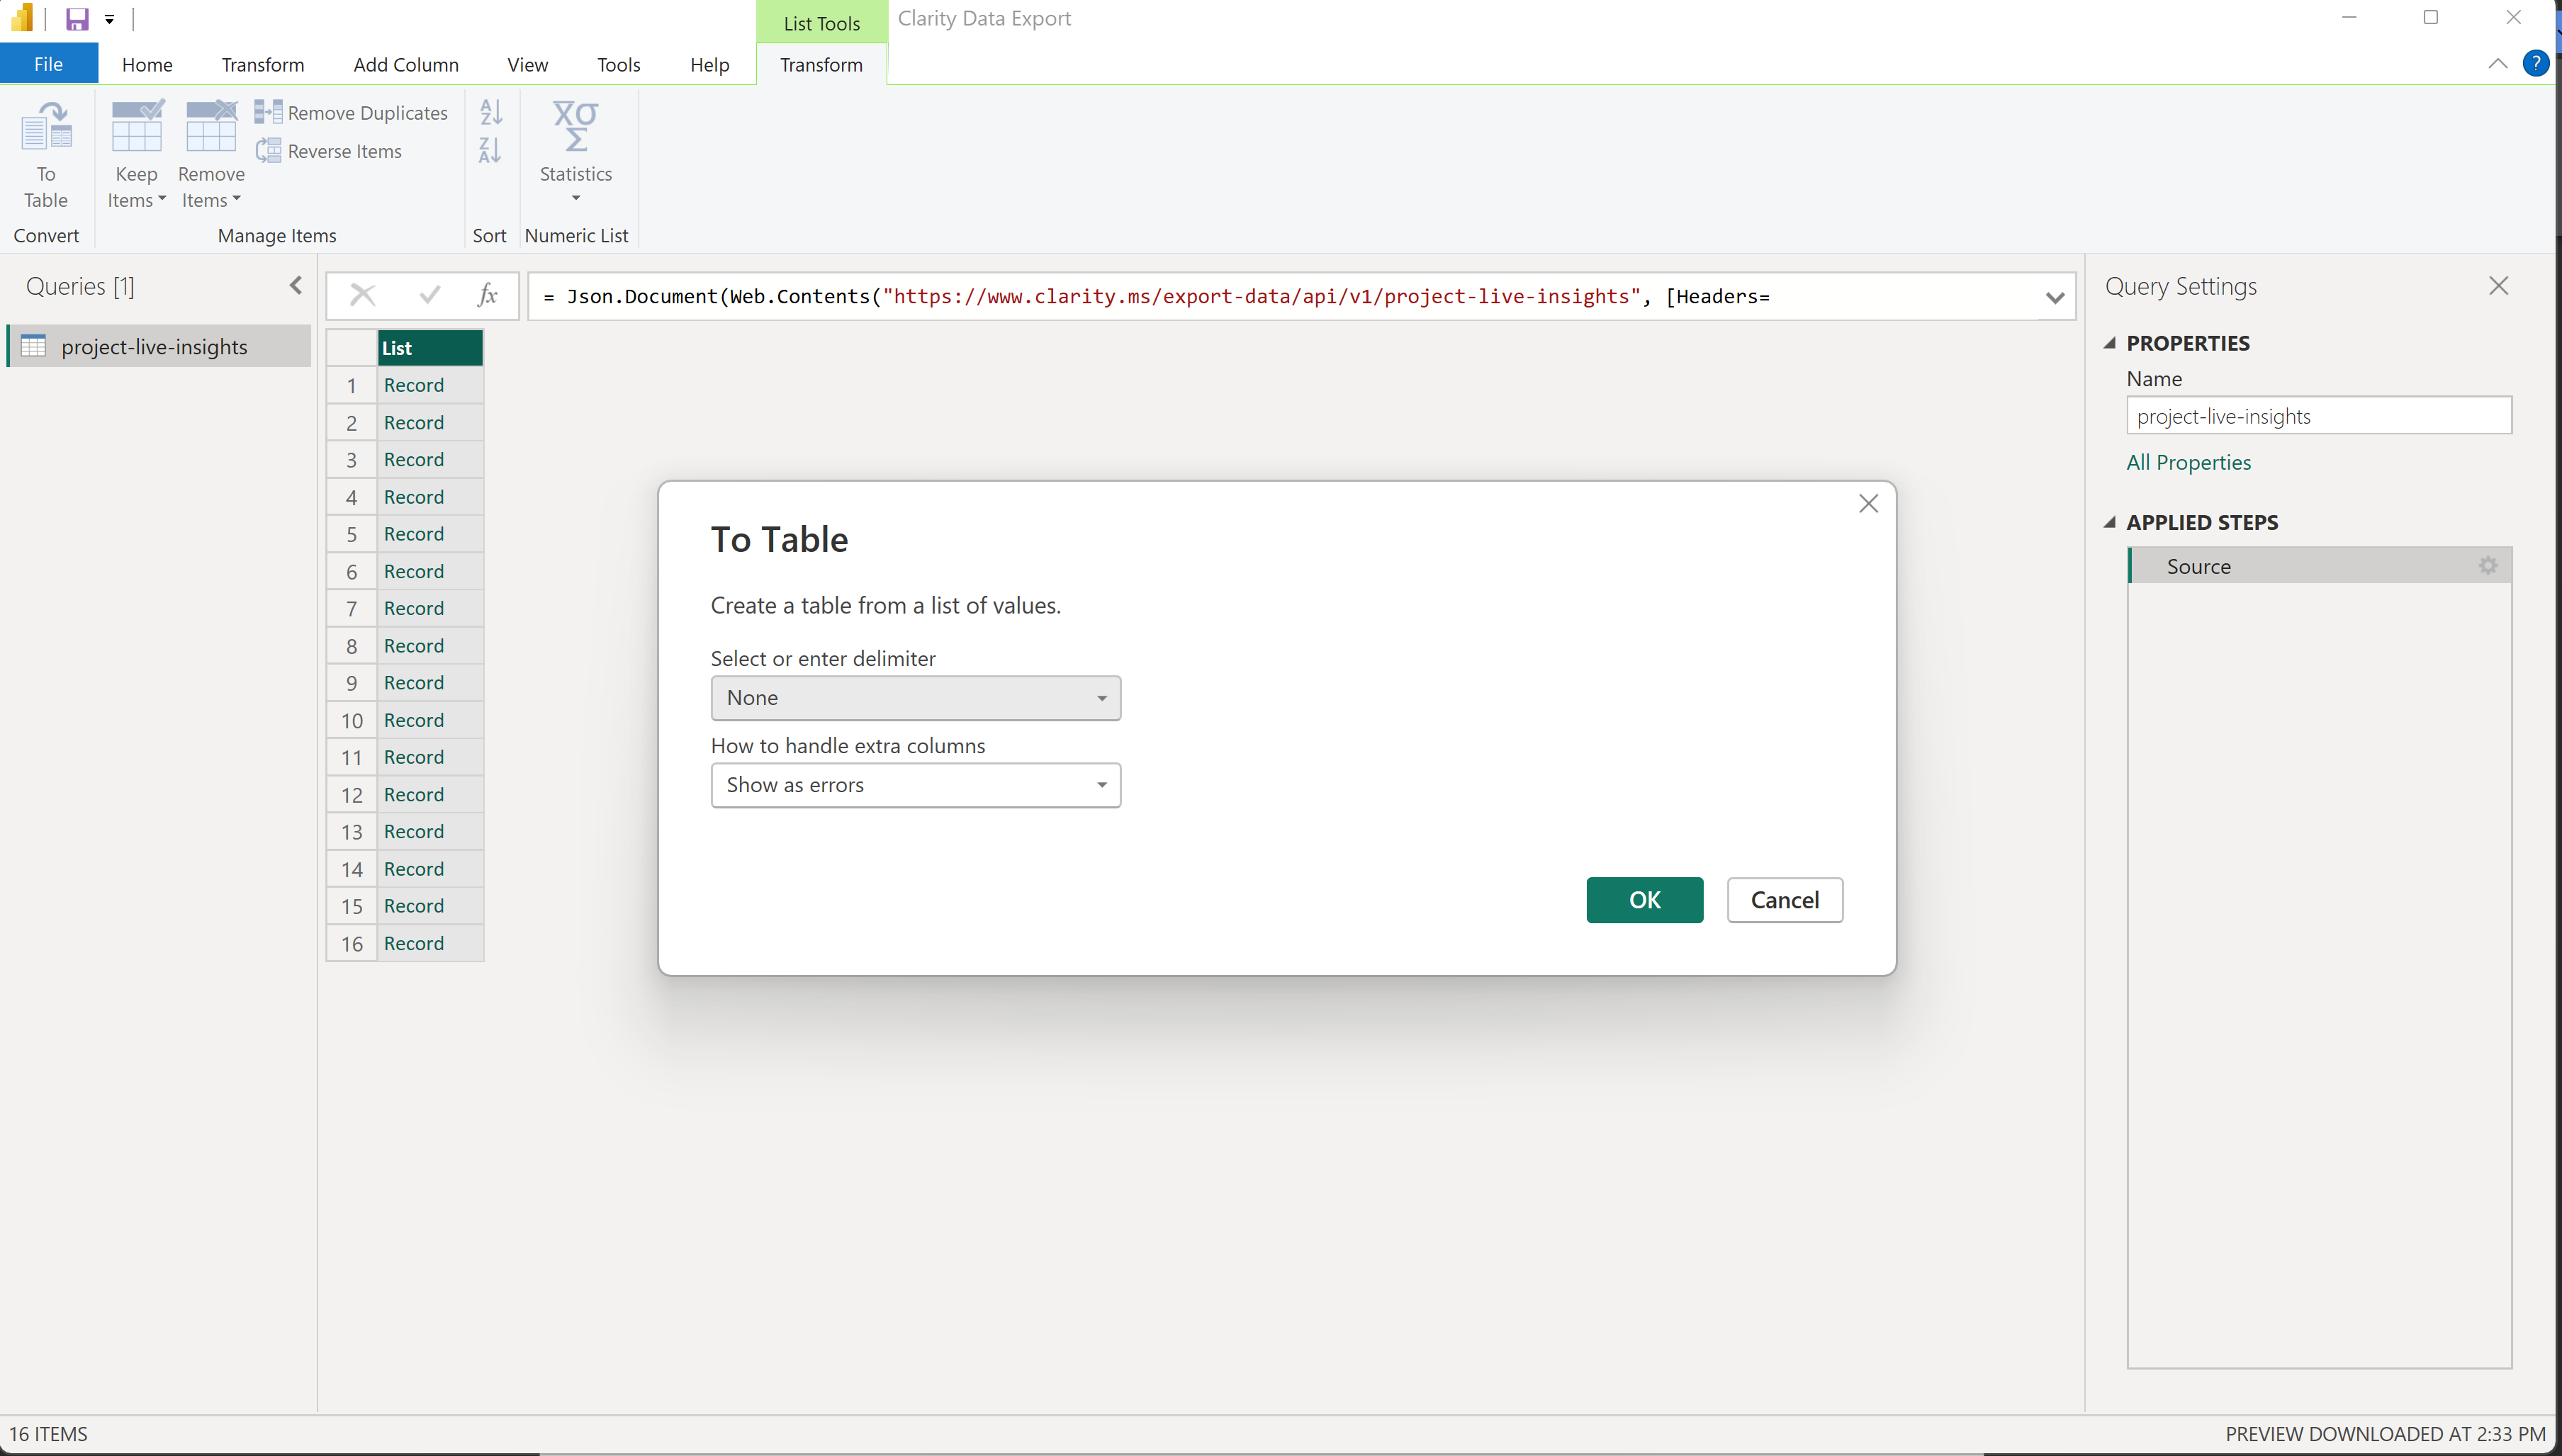
Clarity’s data will be in JSON format, which Power BI is adept at handling. Once data is loaded, select transform data to format it in a tabular form suitable for analysis:
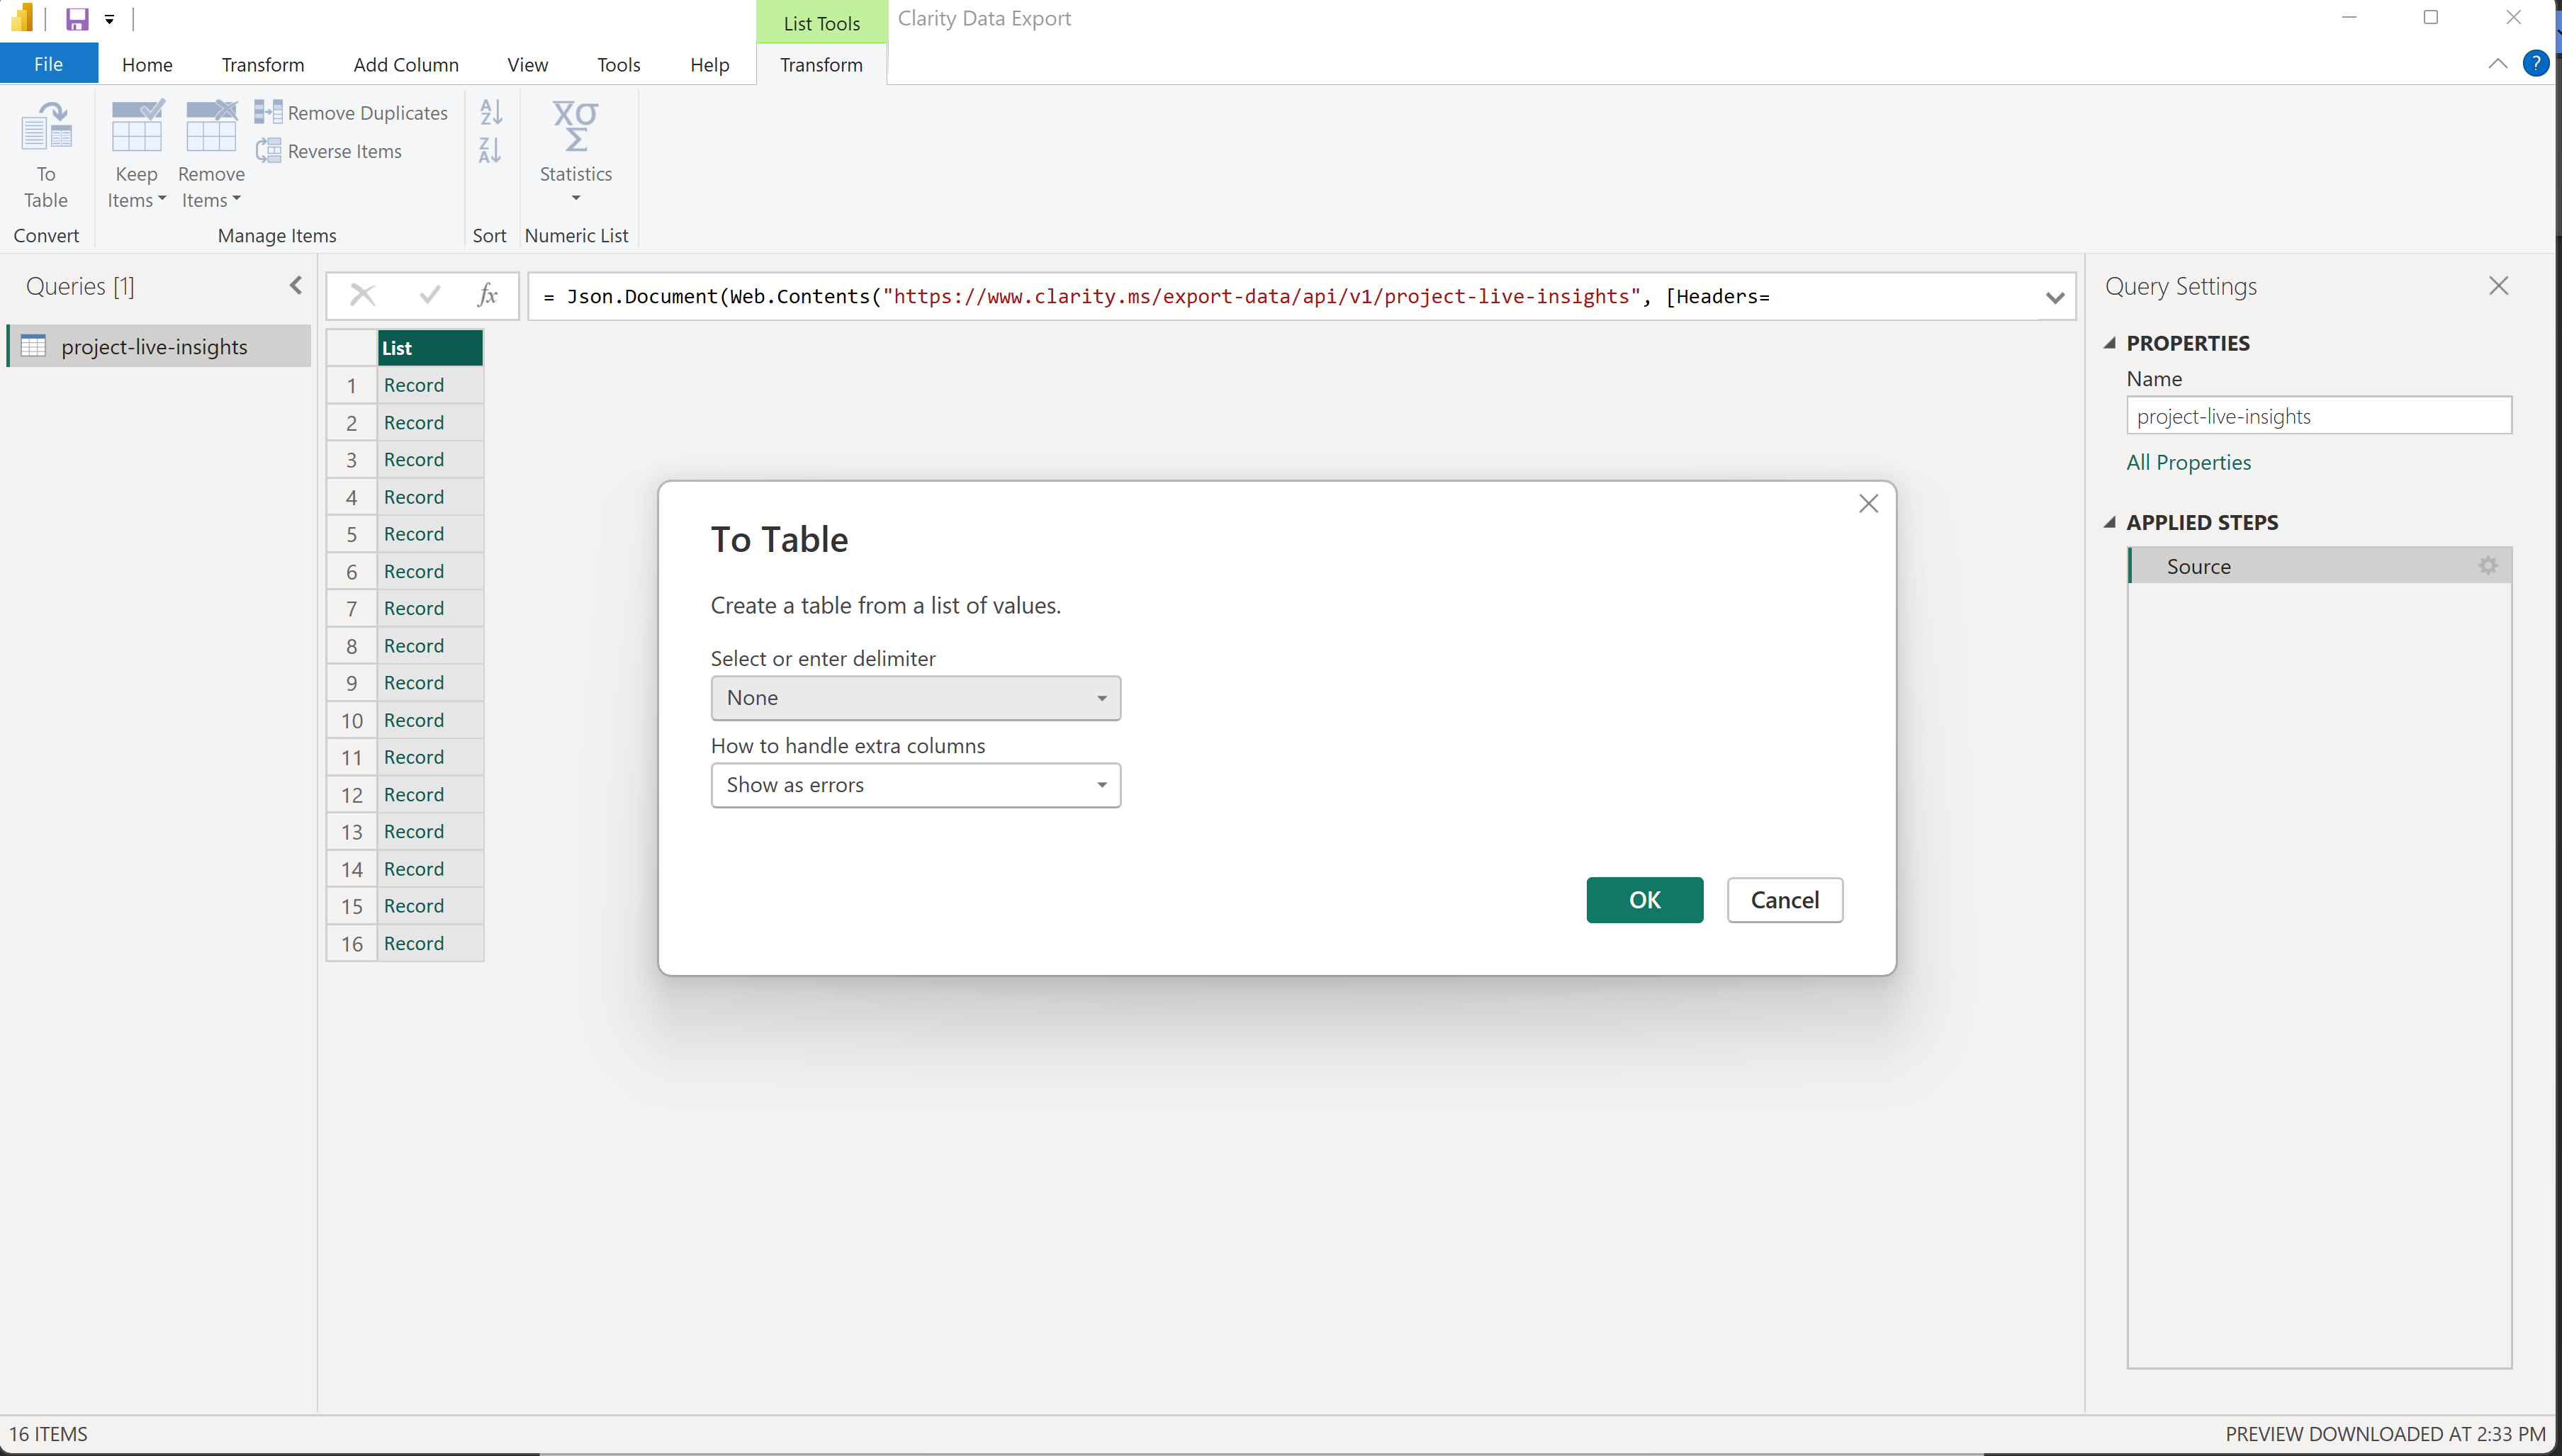
1. Convert the JSON response to a table format.

2. Expand the nested columns to your needs.

3. Rename and adjust columns as necessary.
From there on, you can do whatever filtering and mixing with other data according to your scenario.
Visualizing Clarity Data in Power BI
With your data now in Power BI, the fun part begins – visualization:
- Explore Power BI’s Visualization Tools: Utilize Power BI’s array of visualization tools to turn your Clarity data into insightful graphs, charts, and dashboards.
- Customize Your Reports: Tailor your reports to highlight key metrics and insights relevant to your website’s user behavior.
- Share Your Insights: Publish your Power BI reports to share with your team or stakeholders, providing them with actionable insights based on Clarity’s data.
- Mix your Data: Connect to other data sources and mix it with Clarity data to enrich your insights and empower your decision-making on different aspects of your business.
Integrating Microsoft Clarity with Power BI not only streamlines the data analysis process but also enriches the quality of insights you can derive. This connection empowers you to leverage Clarity’s detailed web analytics in conjunction with Power BI’s advanced data visualization and reporting capabilities, leading to more informed, data-driven decisions for your website or digital product.
Embrace this integration and start exploring new dimensions in your data today!
