
If you are looking for a free way to analyze your website’s performance and user behavior, you might have heard of Google Analytics 4 (GA4), the latest version of Google’s analytics platform. GA4 offers features such as improved cross-device tracking, flexible event-based measurement, and integration with Google Ads. However, GA4 also has some drawbacks and limitations such as a steep learning curve, fewer reports, and data lag.
In this blog, we will show you how to use Clarity as an alternative to GA4 and how to leverage its unique features to optimize your website and enhance your user experience.
What is Microsoft Clarity?
Looking for quick onboarding, simple user experience, and robust analytics? Then look no further than Microsoft Clarity. Clarity is designed to be simple, intuitive, and privacy-friendly and it works well with any website (and mobile apps too!). Clarity helps you understand how your users interact with your website. With recordings and heatmaps, you can see individual user sessions and interactions such as clicks, scrolls, mouse movements, and more.
Can I Use Clarity with Google Analytics?
By using both tools together, you can get a complete and holistic understanding of your both your website and your users. Use GA4 to get a high-level overview of your website’s performance, and then use Clarity to drill down into the user behavior. Clarity provides data on how users navigate and engage with your website. This way, you can uncover issues and opportunities that you might miss if you only use one tool.
Can I Use Clarity as GA4 Replacement?
Here are some ways to use Clarity as an alternative to GA4:
Simple Reports of GA Data: One of the challenges of using GA4 is that it has a different and more complex reporting structure than the previous versions of Google Analytics.
For example, GA4 uses a new concept of analysis modules, which are customizable reports that allow you to create different combinations of dimensions, metrics, segments, and filters. While this can be powerful and flexible, it can also be confusing and overwhelming for many users.
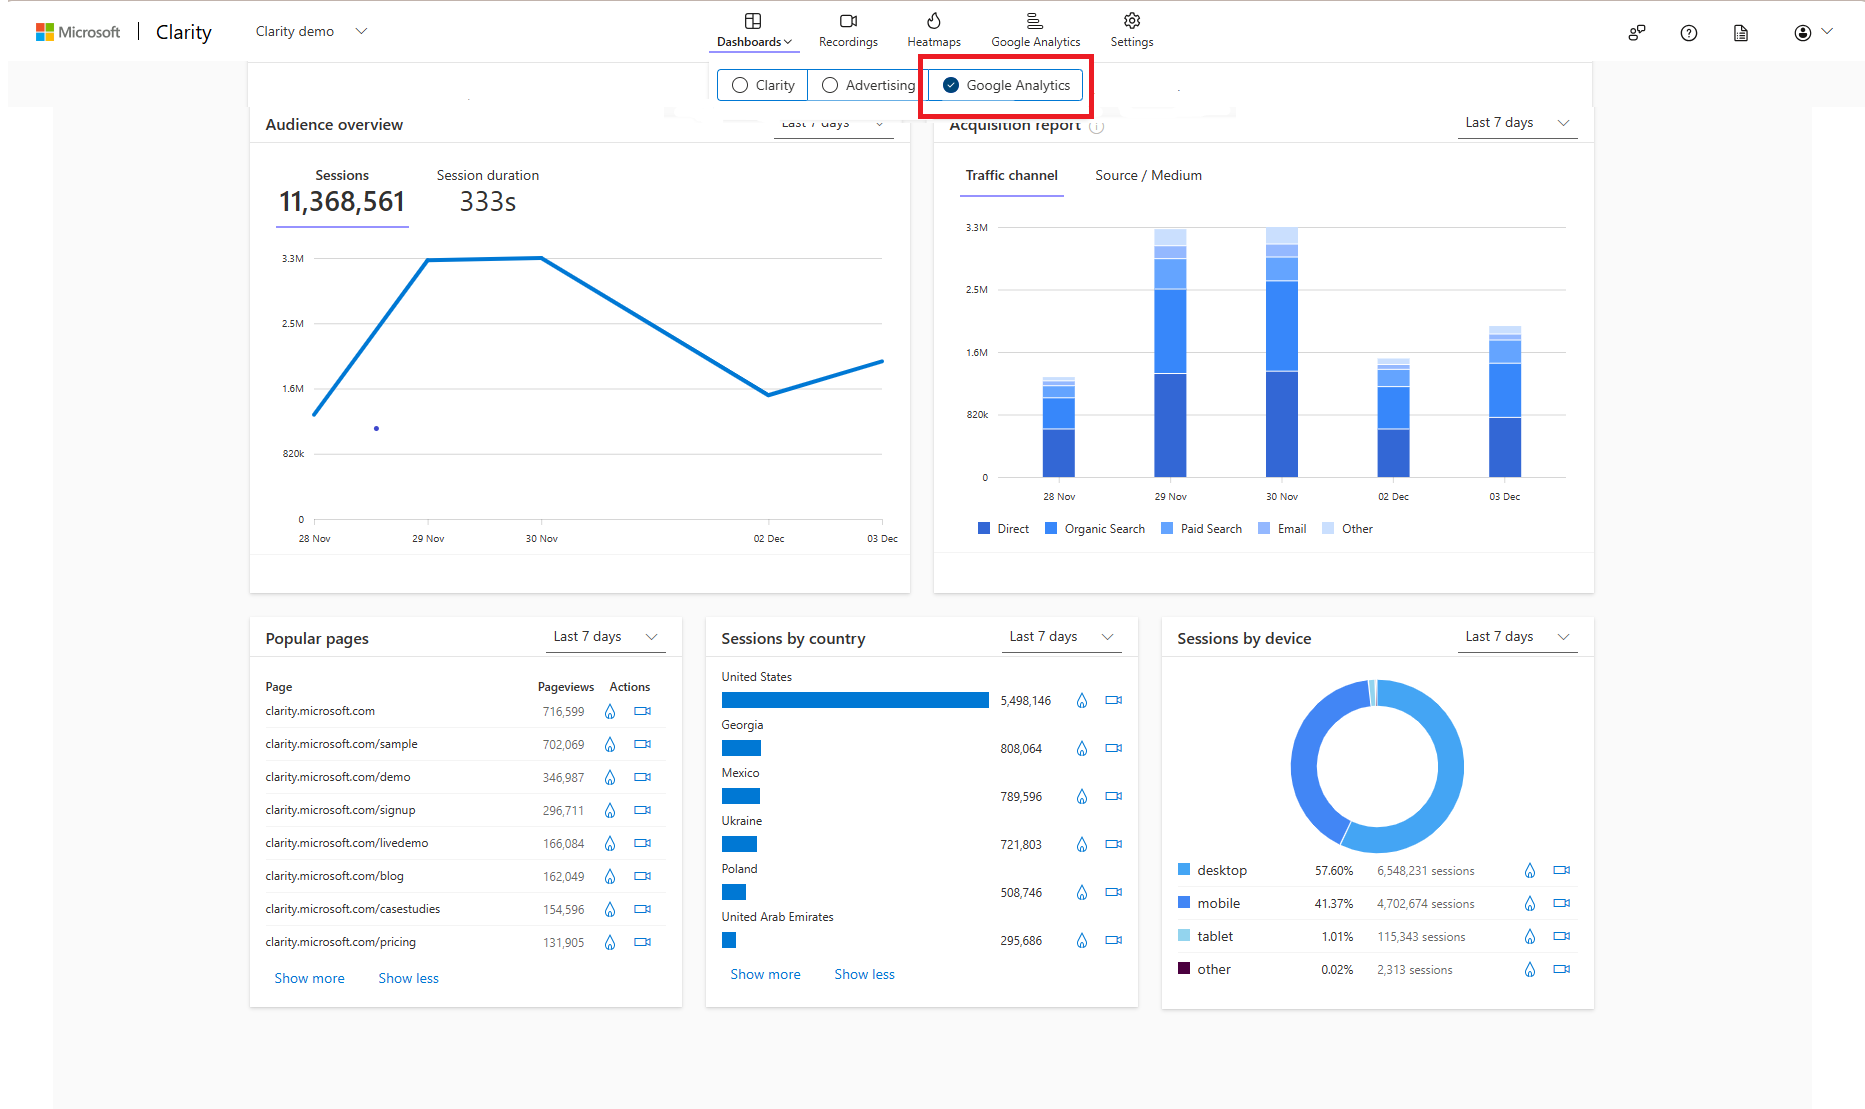
Clarity, on the other hand, has a simpler and more intuitive interface that allows you to easily access and visualize your GA data.
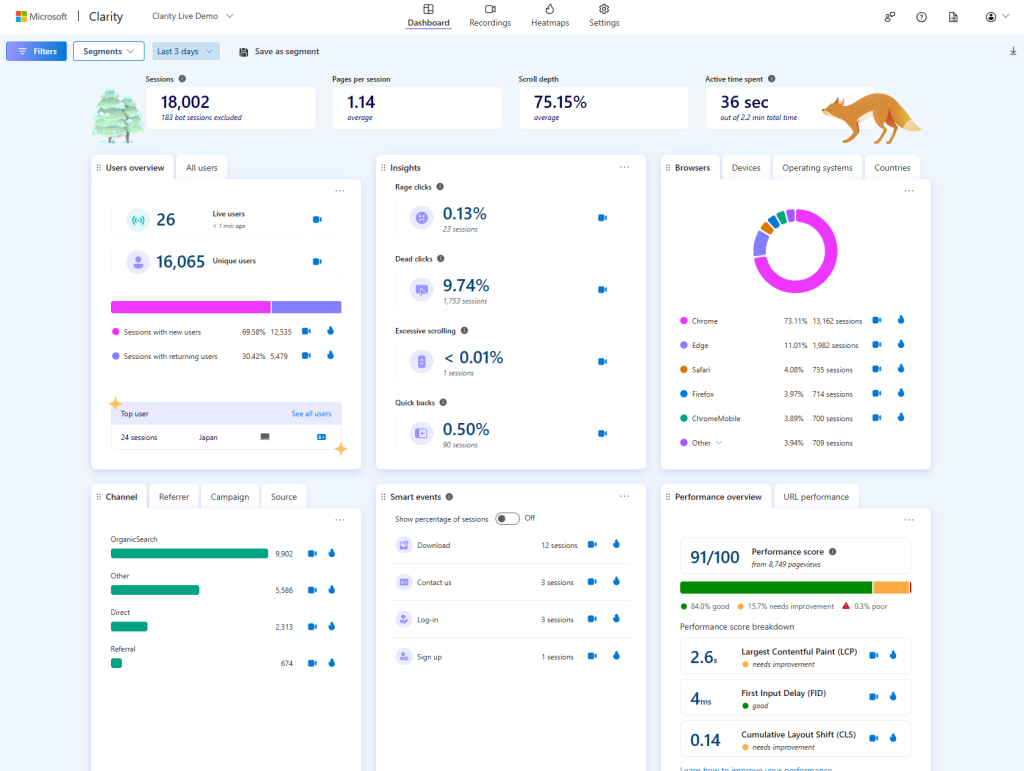
Additionally, you can use the Clarity dashboard to get additional traffic, engagement, and conversion metrics such as popular pages, scroll depth, rage clicks, and other user frustration metrics. If you value live data, Clarity provides a live user count, and all other metrics are available in the dashboard within minutes. No more waiting hours or even days to dive into your data.
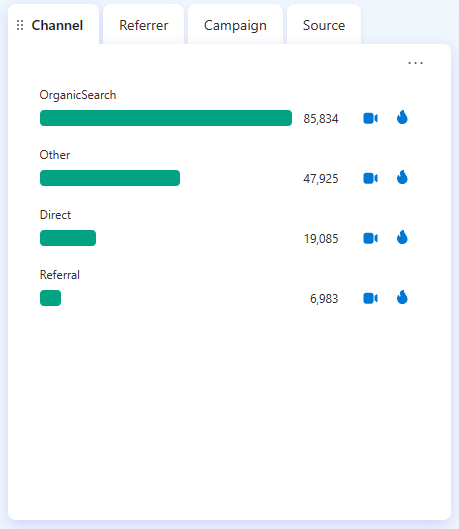
Source Referred Traffic: Another benefit of using Clarity as an alternative to GA4 is that it can help you identify and analyze your source referred traffic, which is the traffic that comes from other websites or platforms that link to your website.
In GA4 it can be difficult to find and filter by this, especially if you have multiple domains or subdomains. Clarity, on the other hand, makes it easy to see and segment your source referred traffic, as it automatically tags and groups your traffic by the referring source, such as search engines, social media, email, or other websites.
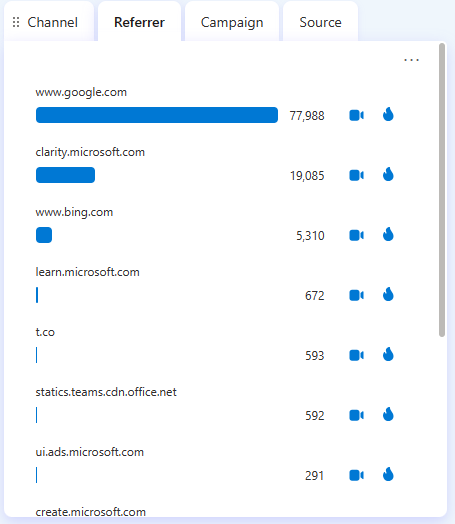
You can also watch the recordings and heatmaps of the user sessions that came from each source. This allows you to understand how your source referred traffic behaves and converts on your website and therefore how to better optimize your website according to your goals.
User Behavior Insights: One of the unique features of Clarity that GA4 does not offer is the ability to view actual user sessions and interaction data on your website. Recordings and heatmaps are two of the most powerful tools that Clarity provides, as they allow you to see how your users navigate and engage with your website, rather than just relying on aggregated metrics and numbers.
You can use the recordings and heatmaps to see where your users click, move their mouse, and type on your website, as well as how long they stay on each page, and what causes them to leave or convert. Filtering and segmentation of your recordings and heatmaps by various filters, such as device, source, location and behavior allow you to identify and analyze user patterns, preferences, pain points, and opportunities allowing you to optimize your website accordingly.

We are constantly listening to user feedback so keep an eye out for future updates around this topic! Check out our blog and case study page for more examples and use cases on how others have used Clarity in the real world.