Our newest product feature ship: new click heatmaps—dead clicks, rage clicks, first clicks and last clicks are officially live in the Clarity Dashboard. With this new feature, users are able to select which type of click map they want to view, compared to the previous version where all clicks were aggregated together. Read more below to learn more about our newly added click heatmaps, how they work and what they can be best utilized for.
Dead Clicks and Rage Clicks
We are now providing users to view click heatmaps and two types of user frustrations, dead clicks and rage clicks. Dead clicks show all areas on the page where customers tried to click but no action was taken. For example, a dead click may involve a broken social media link or a graphic that may look clickable but actually is not. The best use case for dead click heatmaps are to determine what parts of your site might need updates or improvement because it is showing confusion from the end user. These are important updates to make so that the user journey is seamless and what they click on actually provides them with additional information or takes them to another page on your site.
Rage clicks show where users clicked rapidly in the same small area. These types of clicks are often a part of the website where a user gets stuck and will excessively click but nothing happens. Rage clicks are an important type of user frustration to address because you want to make sure the user is engaged and enjoying their journey through your site, not stuck at a certain point with no idea how to proceed.
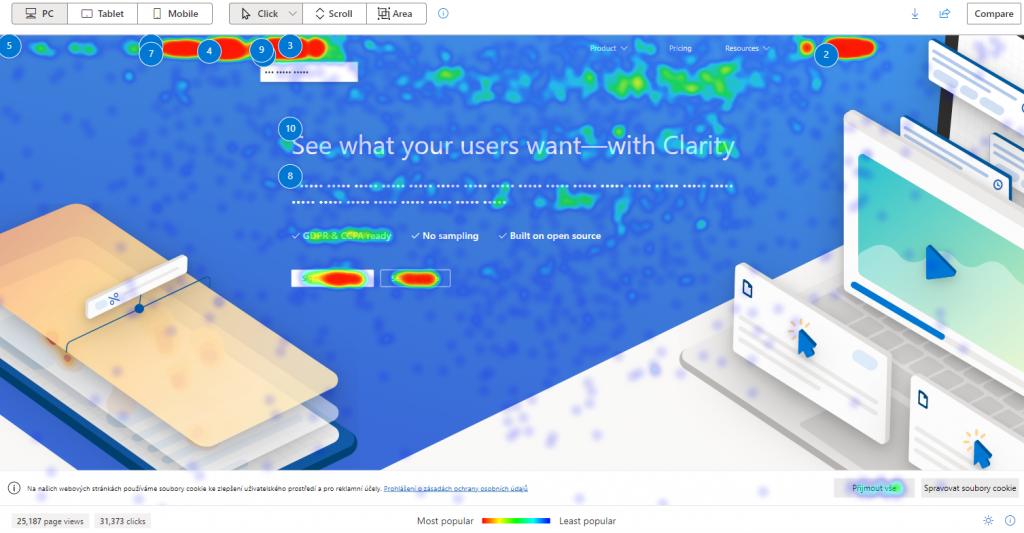
Below are some examples of the different heatmaps on our homepage site:
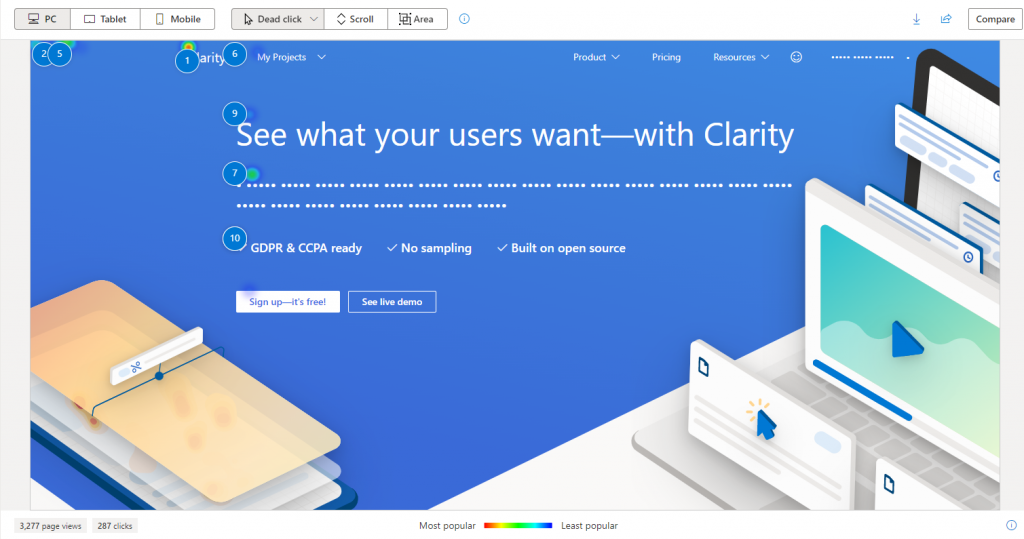
Dead Click Heatmap
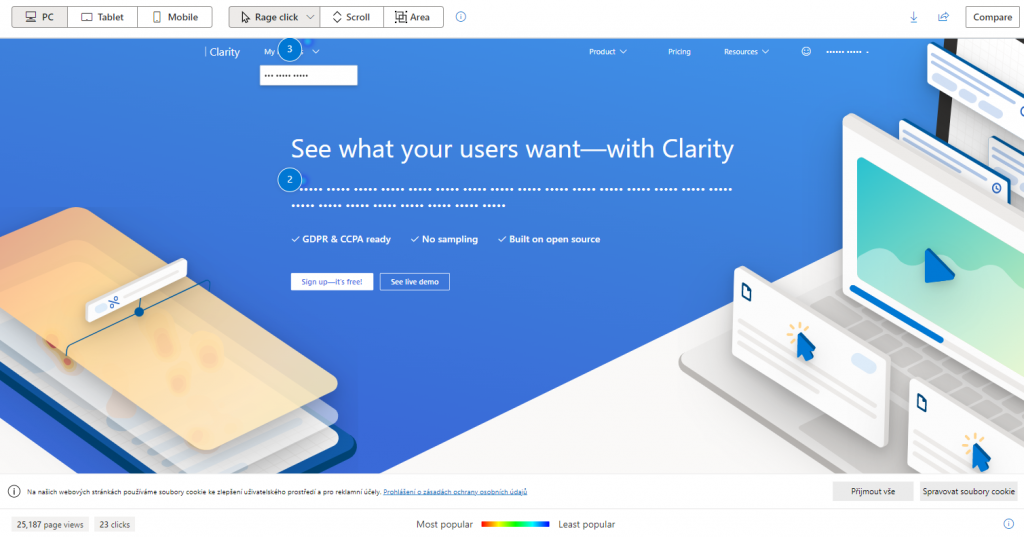
Rage Click Heatmap
Give Your Users What They Want!
Turn users in to customers with heatmaps, insights and more!
First Clicks and Last Clicks
Along with user frustration heatmaps, we’re also added two new user behavioral click maps for users to view.
First click shows the aggregation of the first user click actions on a page. This feature is particularly useful when it comes to finding user onboarding patterns, such as why they may have clicked on one part of the site versus another. For example, you can use this type of heatmap to compare changes made on your site and if users are interacting with part that was changed to see if you should keep or revert back to the original site. Tracking first clicks also show you what your users are most interested in, you can view the recordings of where people went to first and compile which part was click on first the most. As you can see in the screen shot below, the areas with red show what sections of the homepage were clicked on first. The two biggest areas being the projects button and the user account button which means this is where people tend to start when they first enter the homepage.
Last click shows the aggregation of the final click actions on a page. This new feature is useful to find user flow patterns on a site. If you want to track why someone decided to leave your page, last click heatmaps will help aggregate those clicks so you can determine what it was that they last interacted with and make changes accordingly. Where a user exits on their journey could also be particularly helpful when determining where to put certain CTAs or other callouts that may grab their attention or keep them on the page. Similar to the first click heat map, you can see what areas are interacted with the most with last clicks. The projects button and the user account button both are not as red which means that other sections of the homepage are where people tend to click last to move on to another page.
Below are some examples of the different heatmaps on our home page site:

First Click Heatmap
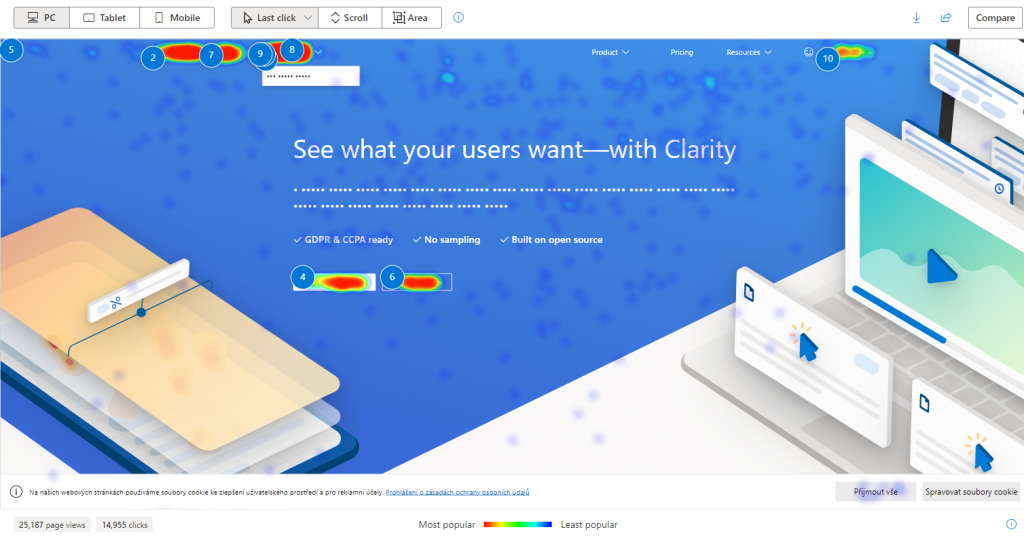
Last Click Heatmap
Again, if you want to see all clicks, we still have the option for all clicks which is an aggregation of all clicks by all users on your site.
All Click Heatmap
We hope the new click heat maps that were recently added continue to help you with your site and why users behave the way they do. There is no additional configuration needed for the new heatmaps as the dropdown option for you to use them has been added already. The heatmaps also work in tandem with additional filters so we hope you find the even more detailed segmentation helpful and useful on your site. And lastly, don’t forget, in addition to just the heatmaps, we provide you with the view recording option as well for each element so you can see exactly how a user clicked on the page for your reference.