
Have you ever wondered how your site stacks up to others in your industry? Are you ever curious about the average stats across the web? Measuring site performance is crucial for improving your business, but it’s often hard to contextualize what that site performance means -when is good actually “good enough”? How is your site doing competitively… and what investments should you be making?
Introducing Clarity Website Benchmarks – Beta
Clarity Website Benchmarks -Beta is our new interactive tool to answer these questions for you. Get a clear picture of the user behavior and trends across the web. And slice it by site category to see how your website stacks up comparatively.
There are three main ways to use this public report:
1. See metrics across the general web.
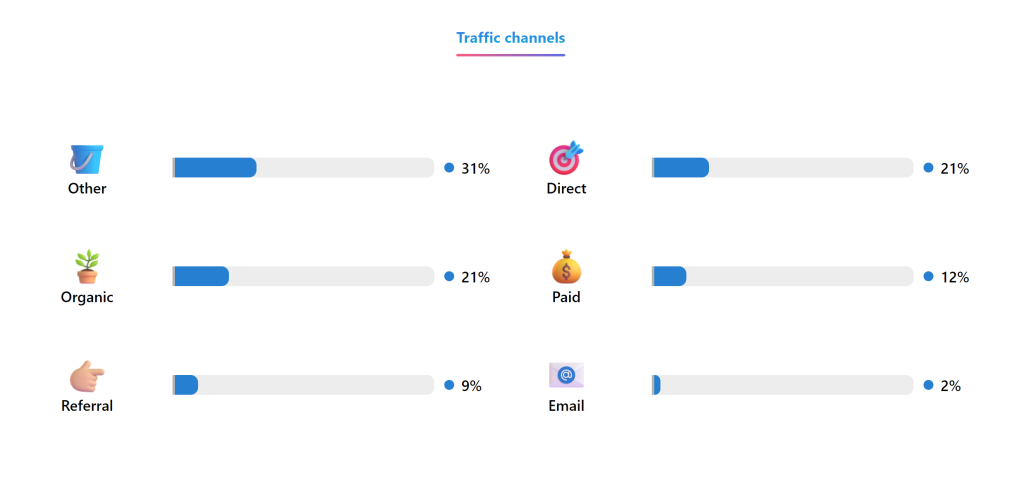
Gauge the average traffic distribution (browser, OS, etc) and average behavioral metrics (rage clicks, quick backs) across the web. Go to the Clarity Website Benchmarks page and scroll down to view these numbers.
2. See metrics for a certain site category
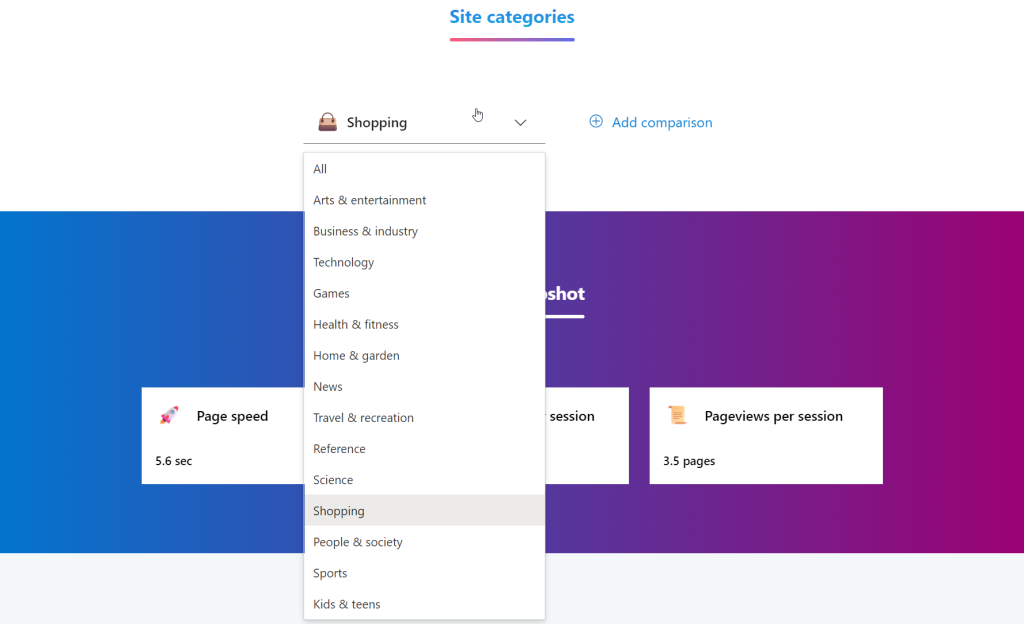
View the same metrics, but filtered to a specific site category. If you’re an e-commerce website, for example, you may find it helpful to apply the “Shopping” filter. This will show you the average traffic distribution and behavioral metrics across sites that are also classified as e-commerce.
3. Compare two site category metrics
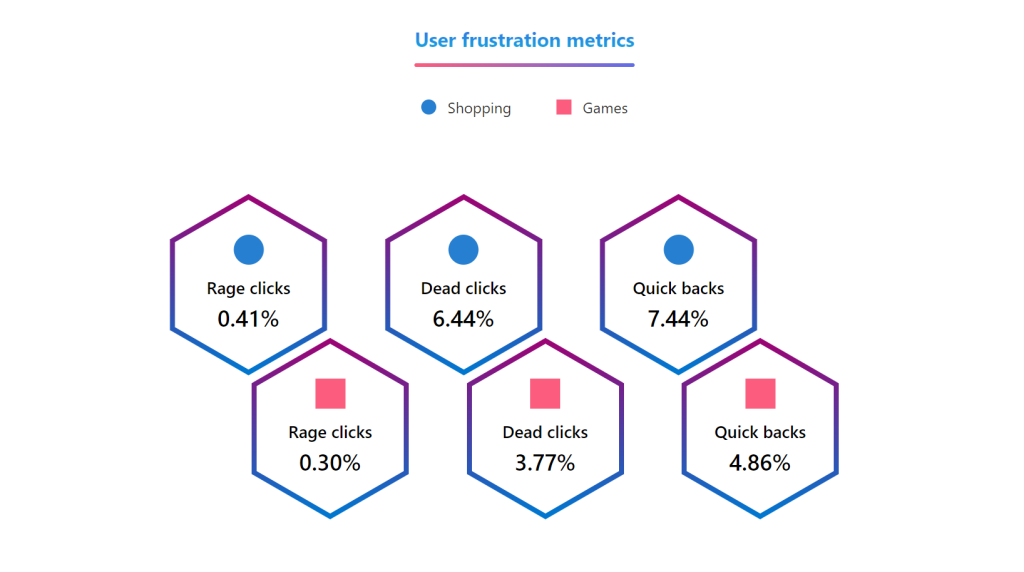
Add a second site category and compare the average stats for two separate site categories. If you’re curious how e-commerce sites and game sites might differ, applying “Shopping” and “Games” filters will show you a side-by-side view of the average stats for each.
Where does Clarity get this data from?
This report aggregates data from billions of anonymous Clarity user sessions worldwide. The metrics we surface in the report are the same metrics we provide for Clarity users via our Clarity product dashboard.
What does “Beta” mean?
We released this tool as a Beta version (i.e., an early release before the tool is officially shipped) because we are continuing to improve the quality and coverage of the data. We welcome your feedback as you use this report -let us know what you like and what additional capabilities you would like to see!
How can I start seeing these benchmark stats?
It’s easy! Clarity Website Benchmarks – Beta is publicly available and updates regularly. Visit Clarity website benchmarks (microsoft.com) to start viewing!
For more details about our Website Benchmarks – Beta, visit our FAQs and documentation.