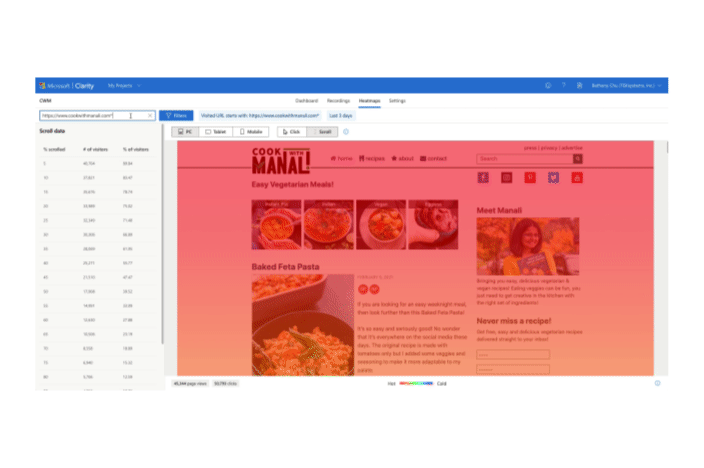
Scroll map – one of the most popular heatmaps types provided by Clarity.
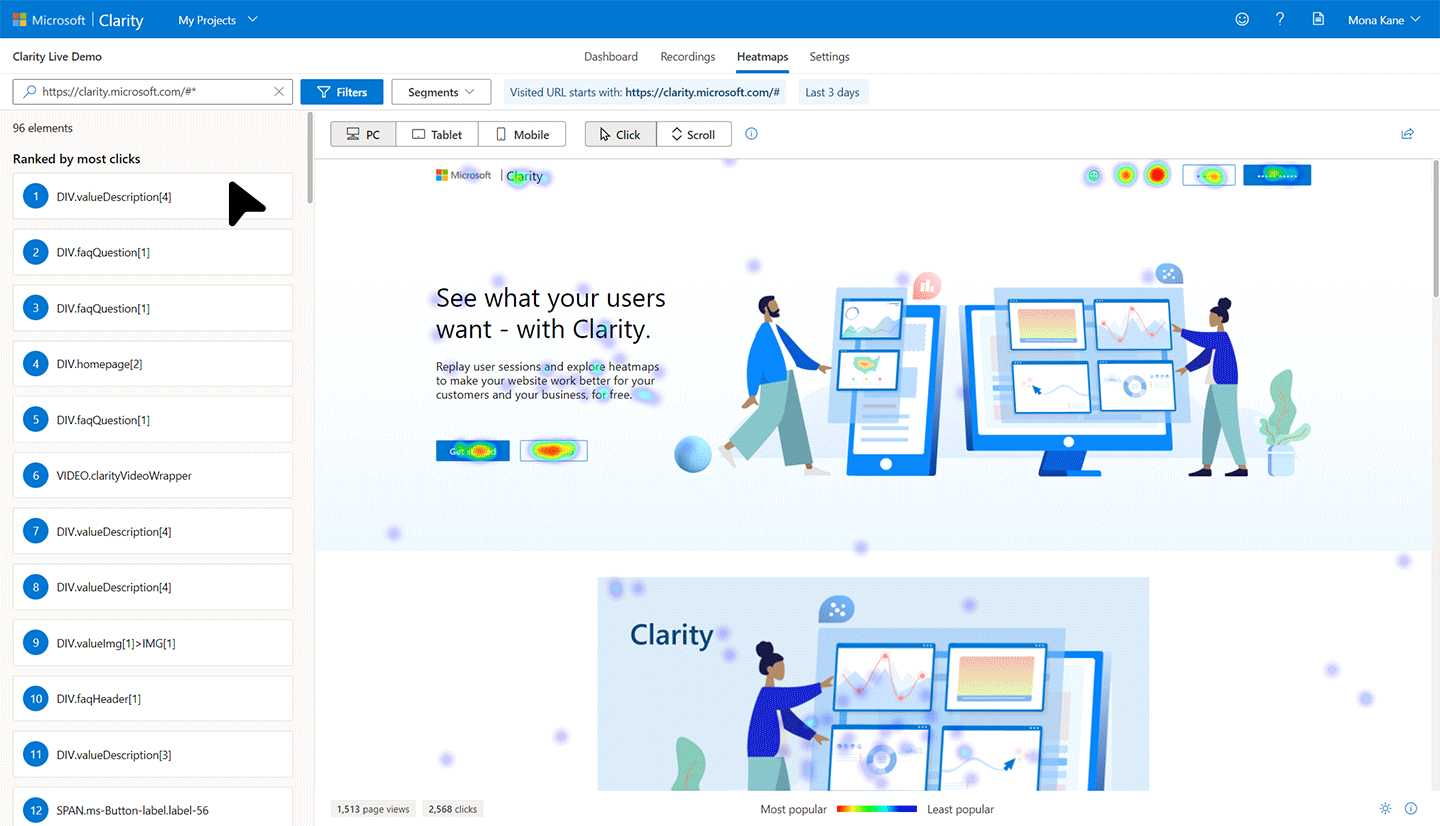
With so many things competing for your users’ attention, it is helpful to know how they are spending time on your website. Microsoft Clarity, our free-to-use behavioral analytics tool can capture useful data about their behavior.
Scroll map basics
The scroll map, one of the most common types of heatmap may look simplistic, but it is actually very powerful in providing insights about your users. The Clarity team has identified scroll maps to be extremely useful in optimizing user interactions on your site.
A scroll map shows how far users scroll on your webpage across desktop, tablet, and mobile.
Clarity shows you detailed color visualization of scroll activity as well as important metrics around how far your visitors scroll on your page and by a given timeframe.
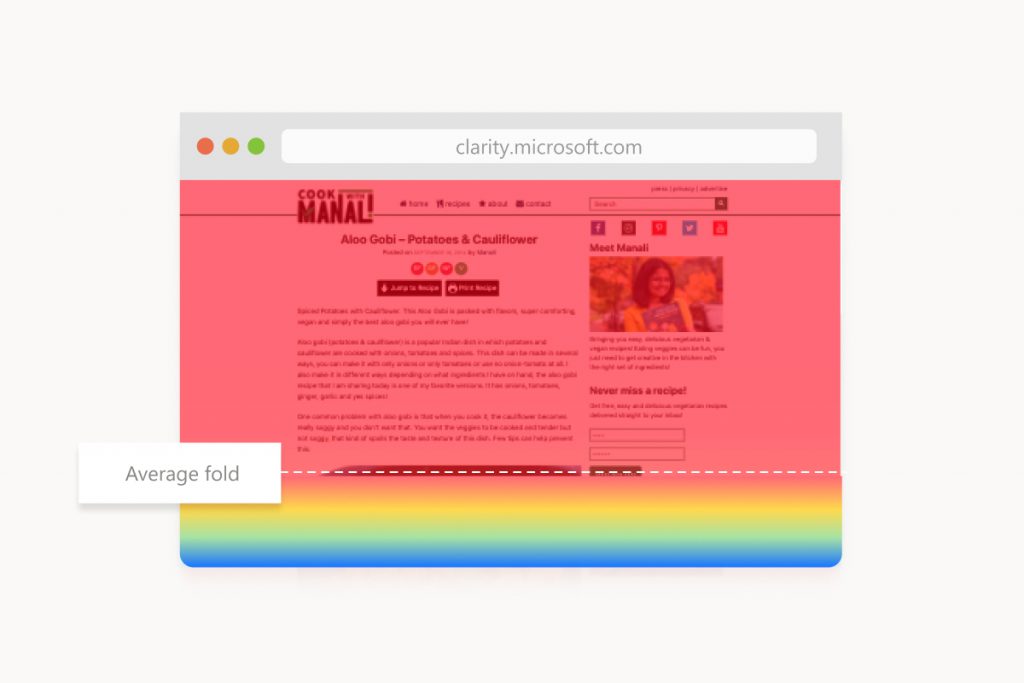
Scroll maps also show you the average fold location on your page. When a user opens your webpage, the part of your page visible without scrolls is defined as the above fold region. The average fold can help you understand if you have enough meaningful connect on the initial page to convince the user to keep scrolling through your content. If you want to dig deeper, you can check out the number of users who have scrolled the average fold point.
5 questions Clarity scroll maps will help you answer
Crucial information about user behavior is at your fingertips with Clarity. Here are 5 questions that Clarity can answer to help you make your website even better.
1. Are your website users seeing the most important content?
Scroll maps tell you how far on the page your users scroll enabling you to see what content is important to them. In general, place the most crucial content higher on the page so it is more likely to be seen. You should also consider how a user’s device impacts their willingness to scroll through your site, so be sure to examine the scroll map data broken down by device.

2. What’s the right content length for your webpage?
Have you ever wondered whether to create short content that is quickly scannable or lengthy content for longer reads? If so, you can benefit by looking at scroll maps for your website to estimate how long your content should be so that your users will engage with it.
Scroll maps can help you to eliminate the guesswork by telling you when readers drop off your content and whether they are willing to read to the bottom. In short, you can more easily plan for the right-sizing of all your content.
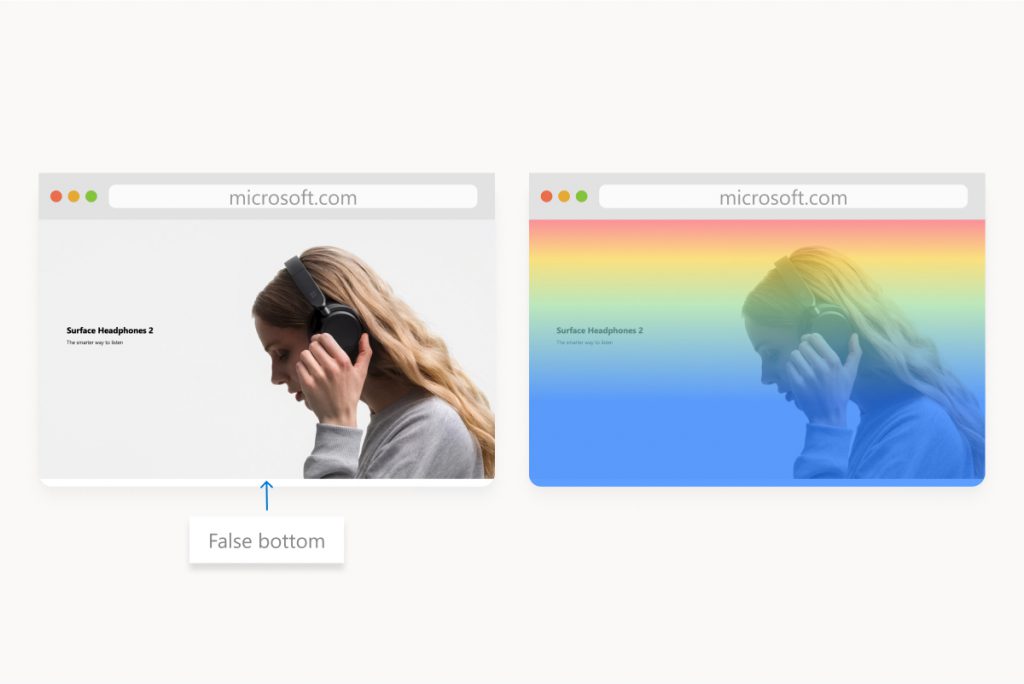
3. Does your webpage have a “false bottom”?
When a scroll map shows a sharp drop-off in users at an unexpected point on your page you could have a “false bottom.” This occurs when parts of your website are cut off by the device or by a design that does not clearly indicate that content is scrollable.
If Clarity shows a surprising drop-off in scrolling, take a closer look. If you find a “false bottom” rearrange your page elements so users can clearly see they can scroll.
4. What is the average screen size of your users?
The average fold is simply the bottom border of what the average user sees before they start to scroll. Clarity calculates this measurement for your webpage and shows you the content seen above and below it. This size varies by device, so Clarity calculates this point for PC, tablet, and mobile.
The general rule is that you want your most important content positioned above it because it is most likely to capture the user’s attention.
5. What are the most important issues to be fixed?
Imagine that you have a broken link in the footer of your site and outdated content in a popular article, but your resources are limited. Which issue do you fix first?
By using a scroll map, you can figure out how many users are impacted by each potential change. Fix the problems that impact the most users most severely.
Clarity helps you to debug your website for example if you’re running an A/B test on an area of your page that the majority of your visitors aren’t seeing, you’ll see clearly the impact on the user attention.
Scroll maps may be the behavioral analytics solution for your website management needs. Here is why:
Instant results. No generation wait time.
You can start seeing data for your website almost immediately.
Slice and dice your results with rich filters on-the-fly.
You can examine page scroll depth, durations users spent on your pages, and more.
No limits on the number of heatmaps.
Get heatmaps on all your web pages of your site or just a few with no extra work.
No additional setup required.
After you’ve set up Clarity, there are no more tags to install or settings to configure.
Clarity is free, with no traffic sampling.
You can start to gain amazing insights into your user behavior with no costly subscriptions or hidden fees allowing you to dig into your heat maps retrospectively.
Microsoft Clarity’s scroll maps eliminate the guesswork to understand the depth of your users’ engagement. We think you will agree that adding a scroll map to your website from Clarity is a no-brainer.