When we introduced Bot Activity in Microsoft Clarity, we brought visibility to a part of web traffic that had traditionally lived in infrastructure logs and been difficult to interpret in an analytics context. For the first time inside Clarity, teams could see how AI systems, crawlers, and automated agents were accessing their content—what platforms were involved, and which pages were being requested.
That visibility marked an important shift. Bot activity was no longer hidden in the background; it became something you could observe and explore.
But visibility is only the beginning.
Once you can see this activity, a new set of questions naturally follows. How significant is this traffic relative to overall site activity? Is this bot activity productive or just expensive? How is this behavior changing over time?
Answering these questions requires not just raw request data, but also structure, aggregation, and tools for deeper analysis.
With this update, AI Bot Activity in Microsoft Clarity expands beyond visibility into deeper analysis. The Bot Analytics dashboard adds richer metrics, clearer signals, and new capabilities to help teams better understand their bot traffic.
The update focuses on three key capabilities.
Understanding the Scale of AI Bot Activity
One of the first challenges with bot traffic is simply understanding magnitude. It’s easy to see that automated systems are accessing a site, but harder to answer how significant that activity is in context.
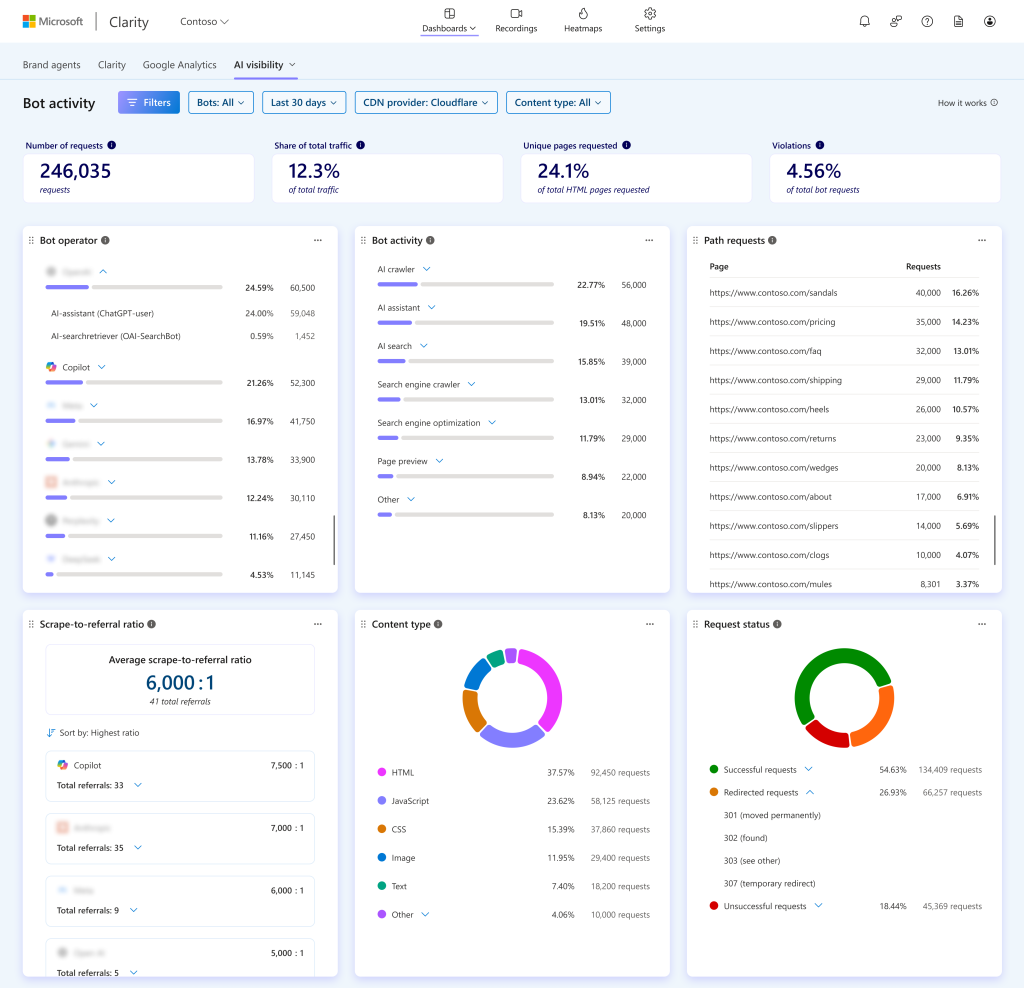
With the new Bot Analytics experience, you can now see:
- AI bot requests (total volume): the absolute number of requests made by AI crawlers and automated systems.
- AI bot traffic share (%): how much of your overall traffic is coming from automated activity.
- Pages crawled (%): the proportion of your site’s pages being accessed by bots.
- Total requests overview: a unified view that anchors bot activity against all site traffic.
- Consistent metrics across traffic types: Bot Analytics info cards now update based on the selected traffic scope, ensuring that metric definitions and values accurately reflect whether you’re analyzing all traffic, all bots, or AI bots. This removes ambiguity and makes it easier to interpret metrics in the correct context.
Together, these metrics move bot activity from a set of isolated observations into a measurable layer of site demand. Instead of knowing that bots are present, you can now understand their scale, concentration, and relative weight across your traffic. Understanding the scale of bot activity helps you determine whether AI systems are meaningfully engaging with your content and where that demand is concentrated. This gives you a clear signal of where to prioritize optimization and investment to improve your visibility in AI-driven discovery.
Evaluating the Quality of Bot Interactions
Not all bot traffic behaves the same way. Some requests successfully reach content as intended, while others are redirected, blocked, or fail due to infrastructure or routing conditions. Understanding this difference is key to evaluating whether automated access is efficient or creating unnecessary load.
With the enhanced Bot Analytics dashboard, you can now analyze:
- Request status breakdown: See how bot requests are distributed across successful, redirected, and unsuccessful outcomes.
- Request status trends over time: Track how the reliability and outcome of bot traffic changes over time.
- Interactive filtering by status: Click into specific request outcomes to isolate patterns and investigate further.
- CDN violations: Detect bots accessing disallowed paths in violation of robots.txt, with trend tracking and filtering to pinpoint problematic crawlers.
These signals help move beyond raw volume and into operational clarity. Instead of only knowing that bots are visiting your site, you can now understand whether those visits are efficient and successful or potentially creating unnecessary infrastructure load through failed or inefficient requests.
If you’re seeing a high number of unsuccessful requests, it may indicate that AI systems are unable to properly access your content, whether it’s due to blocked access, broken URLs, or restricted pages. This results in in missed opportunities to be discovered or referenced in AI-generated answers. To avoid this, make sure your pages are accessible to bots, free of errors or broken links, and easy to crawl and load reliably.
Identifying Patterns and Opportunities
Once you understand scale and quality, the next step is recognizing patterns: where bot activity is concentrated, how it changes over time, and which parts of your site attract sustained automated attention.
With the enhancements to Bot Activity in Clarity, you can now:
- Analyze trends across all key metrics, Including requests, share, and crawl coverage over time.
- Filter across domain and path levels. Isolate specific sections of your site to understand localized behavior.
- Use click-to-filter exploration. Quickly drill into request statuses or path-level activity without leaving the dashboard.
- Track request patterns at the path level. Identify which pages and resources consistently attract bot attention.
Together, these capabilities help surface meaningful structure in what was previously a high-volume signal. Instead of viewing bot activity as a single stream of requests, you can now break it down into patterns. In practice, this helps you pinpoint where AI systems are focusing and prioritize those areas for content improvement and optimization. By doubling down on high-interest pages and topics, you can improve how your brand is surfaced in AI-answers. You can use these trend lines to evaluate the impact of changes over time to monitor if updating content, restructuring pages, or improving accessibility led to increased coverage.
Bot Activity Capabilities at a Glance
Take a closer look at the key metrics and capabilities available in the Bot Activity dashboard.
New Metrics and High-Level Insights
- AI bot requests (total number of requests from AI crawlers and automated systems)
- AI bot traffic share (% of total site request volume)
- Pages crawled (% of total pages accessed by bots)
- Total requests overview for unified activity tracking
Request Status Visibility
- Breakdown of bot requests by status: successful, redirected, and unsuccessful
- Trendlines added to request status and key metric cards
- Click-to-filter from request status for deeper analysis
Expanded Exploration and Filtering
- Domain-level and path-level filtering across all bot analytics views
- Click-to-filter support for path requests and request status
- Improved interactivity across dashboard tables and metric cards
Content Type and Table Improvements
- New Content Type card aggregating request distribution by content type
- Removal of content type from Path Requests table for cleaner structure
- Refactored Path Requests view with improved aggregation and consistency
Expanded CDN Support
- New integrations for Akamai and Azure Front Door (AFD)
- Integrations for non-enterprise Cloudflare plans, including free, pro, and business.
Getting Started
AI Bot Activity is now available in Microsoft Clarity under Dashboards → AI Visibility → AI Bot Activity.
Project admins can enable this feature by connecting a supported CDN through the AI Visibility section in the Project Settings. The self-serve onboarding experience shows currently supported CDN providers and upcoming integrations.
Supported CDNs include Fastly, Amazon CloudFront, Cloudflare, Azure Front Door, and Akamai.
For WordPress sites using the latest Microsoft Clarity plugin, AI Bot Activity will be available automatically. Sites running an older version of the Clarity plugin for WordPress will need to update it to access the feature.