
Session recordings show what your users are doing on your site. If you don’t understand your customer journeys, you are guessing ways to improve your website.
Watching your users’ sessions is one of the first steps that can help you gain insight into their motivations, clicks, and actions.
But have you found yourself…
- Watching hundreds of session recordings to find a pattern and wished it could be easier? 🤔
- Wondering if a particular user session pattern is the biggest issue? 🤔
Then this blog post is for you!
If you don’t have unlimited time for analyzing session recordings, we feel your pain.
We have spent a lot of time figuring out a smarter way to help you discover the right sessions. The result – is a big new feature!
Introducing: Interesting user segments! 🥳
The Clarity dashboard is a great place to look at the big picture for user metrics and until now our dashboard provided a holistic view of the top behavioral metrics that impact your site. This combined with our rich filter set, you could dig deep into questions you wanted to be answered.
As a result, there is more!
With Interesting user segments, our Clarity insights go beyond our standard behavioral metrics and give you the top segments that contributed to it.
Get Started and see your Interesting user segments today! Free Forever! 🤗
Session recordings – Let’s walk you through an example:
Let’s say you want to better understand the reasons behind a high number of rage clicks on your website (that is, where users rapidly clicked or tapped in the same spot).
You could scan through hundreds of session recordings to understand why customers are rage-clicking on your site.
or…
You could look first at Clarity’s Interesting user segments that identify which user behaviors are causing this issue…

…and validate it by watching a couple of those sessions!
Let’s explore this example a bit further.
A company recently launched an email campaign to promote its new website across various online platforms.
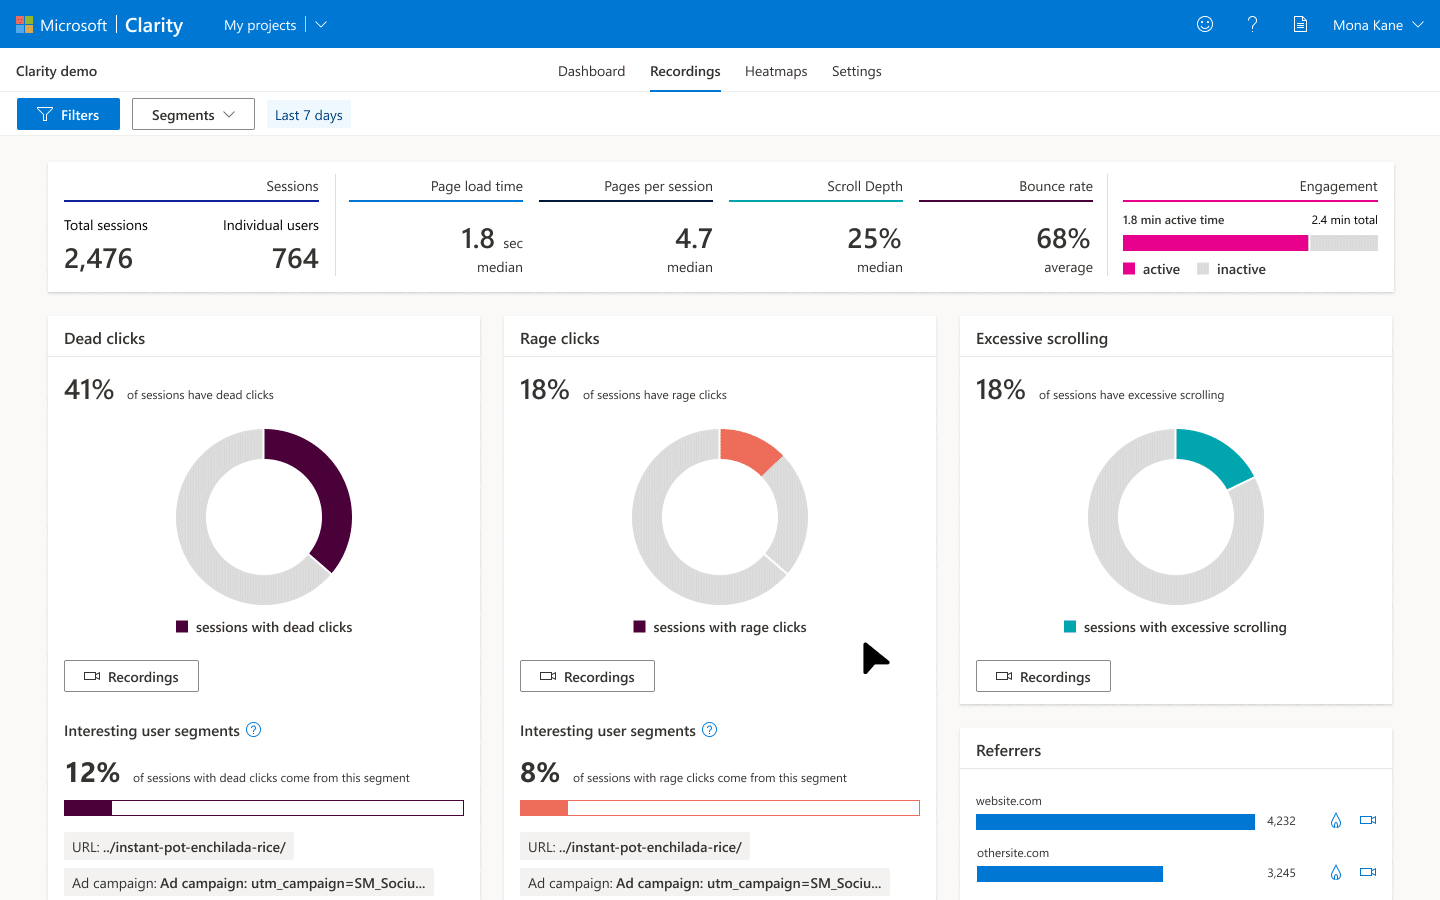
The Clarity dashboard shows the top user segments contributing to rage clicks, a key frustration metric that was present in 23.28% of all their user sessions.
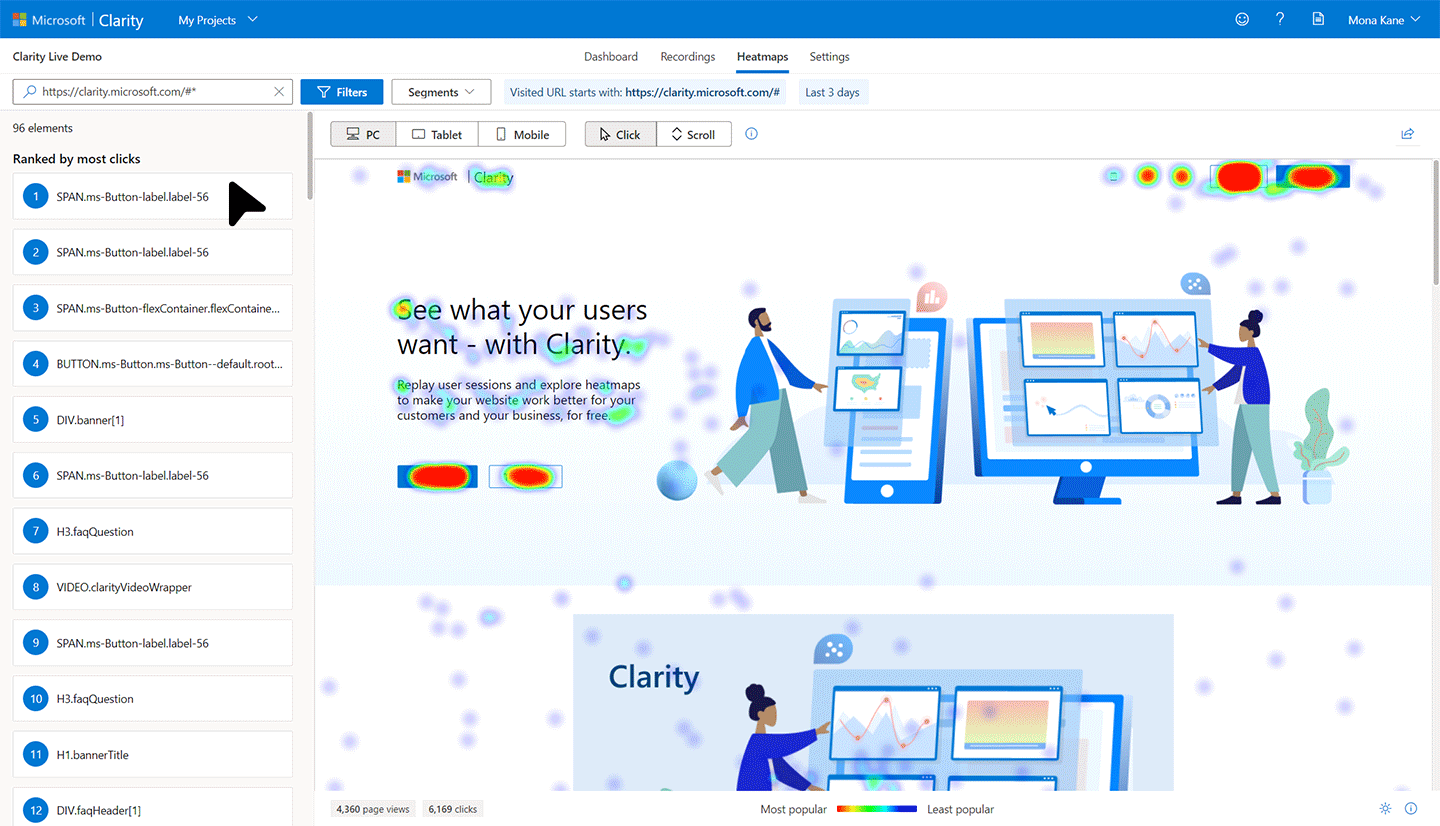
With Interesting user segments, you can see the distribution of rage clicks across key user segments: country, medium, OS, etc.
Notice that 51.1% of total rage clicks come from Windows users in India who are visiting the site from the email promotional campaign “2021 Winter”.
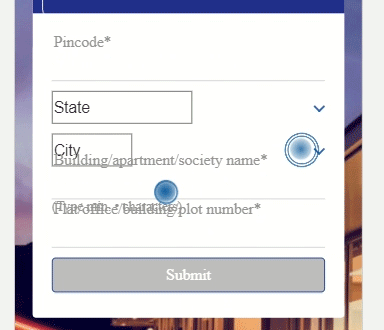
The company then clicks on recordings to get a view of the cohort of users with rage clicks.
Selecting one of these recordings reveals an underlying issue: one of the form elements is broken, a major contributing factor for rage clicks.
Users were trying hard to fill in their details which caused frustration and therefore rage clicks.
In order to validate the fixes, the company continued to monitor this segment by choosing the “Save as segment” option. They gave the segment a friendly name like “Rage clicks on Winter 2021 Campaign” so that they could find users running into these issues again easily.
Get Started and see your Interesting user segments today! Free Forever! 🤗