
The expectations of website users are higher than ever. They want their browsing experience to be frictionless, personalized, and mobile optimized —on every device, every time. And each page needs to load in the blink of an eye.
To meet this high standard, it’s not enough to track views or bounce rates. You need both in-depth quantitative data that shows what users are doing and qualitative feedback that explains why. That’s where Microsoft Clarity and UserFeedback come together.
The Power of Clarity + UserFeedback
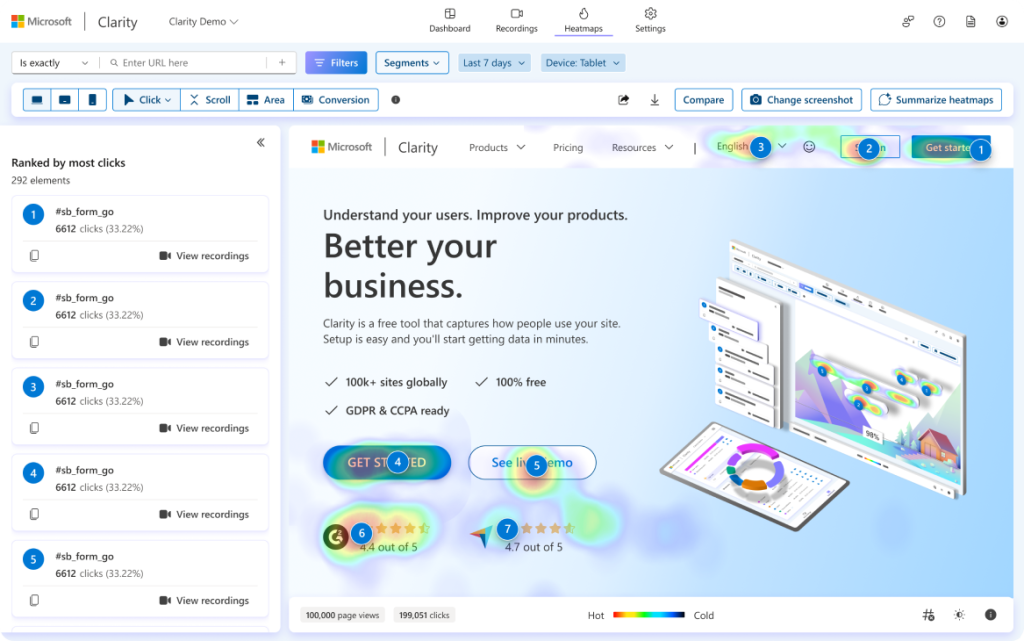
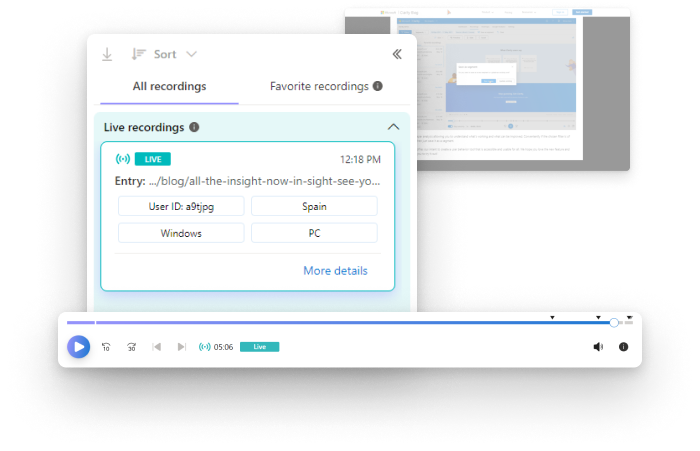
Microsoft Clarity is a free behavior analytics tool that shows how users interact with your website through heatmaps, session recordings, and engagement insights like rage clicks—helping you spot and fix UX issues quickly.
UserFeedback complements this by capturing the “why” behind user behavior. It’s a lightweight, on-site survey tool for WordPress that lets you gather direct input from visitors—providing quick, qualitative insights into their experience, satisfaction, and pain points.
Key features of UserFeedback include:
- Unlimited, Flexible Surveys – Ask any number of questions to any number of users with multiple choice, free text, or star rating formats.
- Customizable & Targeted – Match your site’s look, choose where surveys appear, and target users by page or device.
- Clear Insights & Easy Exporting – View simple reports, get notified of new responses, and export data to CSV or Excel for deeper analysis.
By integrating these two tools together, you can unlock a more complete picture of user behavior.
Key Benefits
When Clarity and UserFeedback work together, you get the what and the why in a single workflow. That’s a game-changer for UX teams, marketers, and developers alike.
Gain Deeper User Insights
Combining both quantitative and qualitative data allows you to identify and validate key insights about your website. For example, if responses to your surveys in UserFeedback express frustration with the user experience, you could identify the specific pain points causing this frustration with Clarity’s rage clicks metric.
Interpret Data with Qualitative Feedback
By combining Clarity and UserFeedback, you can understand the “Why?” behind the data and diagnose friction points without turning to guesswork.
Say, for example, you used Clarity’s heatmaps to identify that 50% of users don’t scroll past the first fold of a page. You could create a survey in UserFeedback to ask visitors why they didn’t view more of the page and make adjustments based on your findings.
See the Behavior Behind Users’ Feedback
Users know when something’s broken — but they don’t always know why. As a result, their feedback might point out the symptom, but not identify the underlying issue.
Say, for example, a user had trouble filling out a form. As a result, they might report that the ‘Submit’ button is broken. But by watching session recordings, you could identify that the button is working properly, but an accessibility issue caused them to miss a required form field, which blocked the form submission.
This kind of context helps teams resolve website problems faster and more accurately.
Get Started in Minutes
Don’t just guess what users need — know for sure.
By combining Microsoft Clarity’s visual behavior data with UserFeedback’s direct visitor input, WordPress users can quickly identify problems, understand user intent, and make smarter decisions to improve UX and drive results.
Whether you’re optimizing landing pages, testing design changes, or diagnosing drop-off points, this integration gives you the complete picture — and the confidence to act on it.
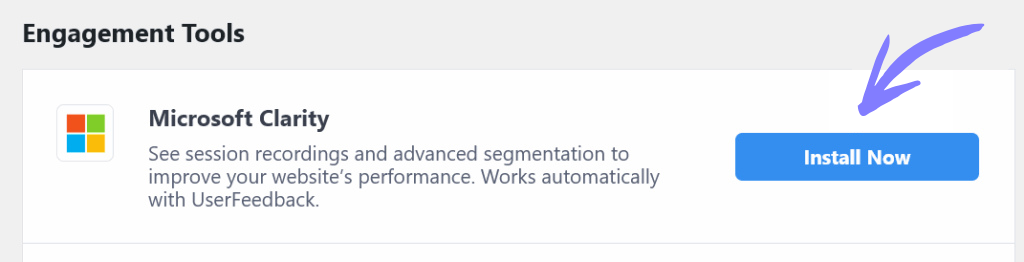
Integrate Clarity and UserFeedback today to unlock the full story behind user behavior. Follow the step-by-step guide to get started.