Heatmaps in Microsoft Clarity visually represent user interactions like clicks and scrolls, helping you optimize your site. Learn how click maps reveal popular areas, scroll maps show user engagement, and area maps track clicks in specific regions.
You can compare heatmaps across devices, perform A/B testing, and switch between screenshots to analyze different page versions. Filters allow you to focus on specific user segments, and session recordings offer deeper insights. Plus, our AI Copilot summarizes key data, making it easier to spot trends and issues.
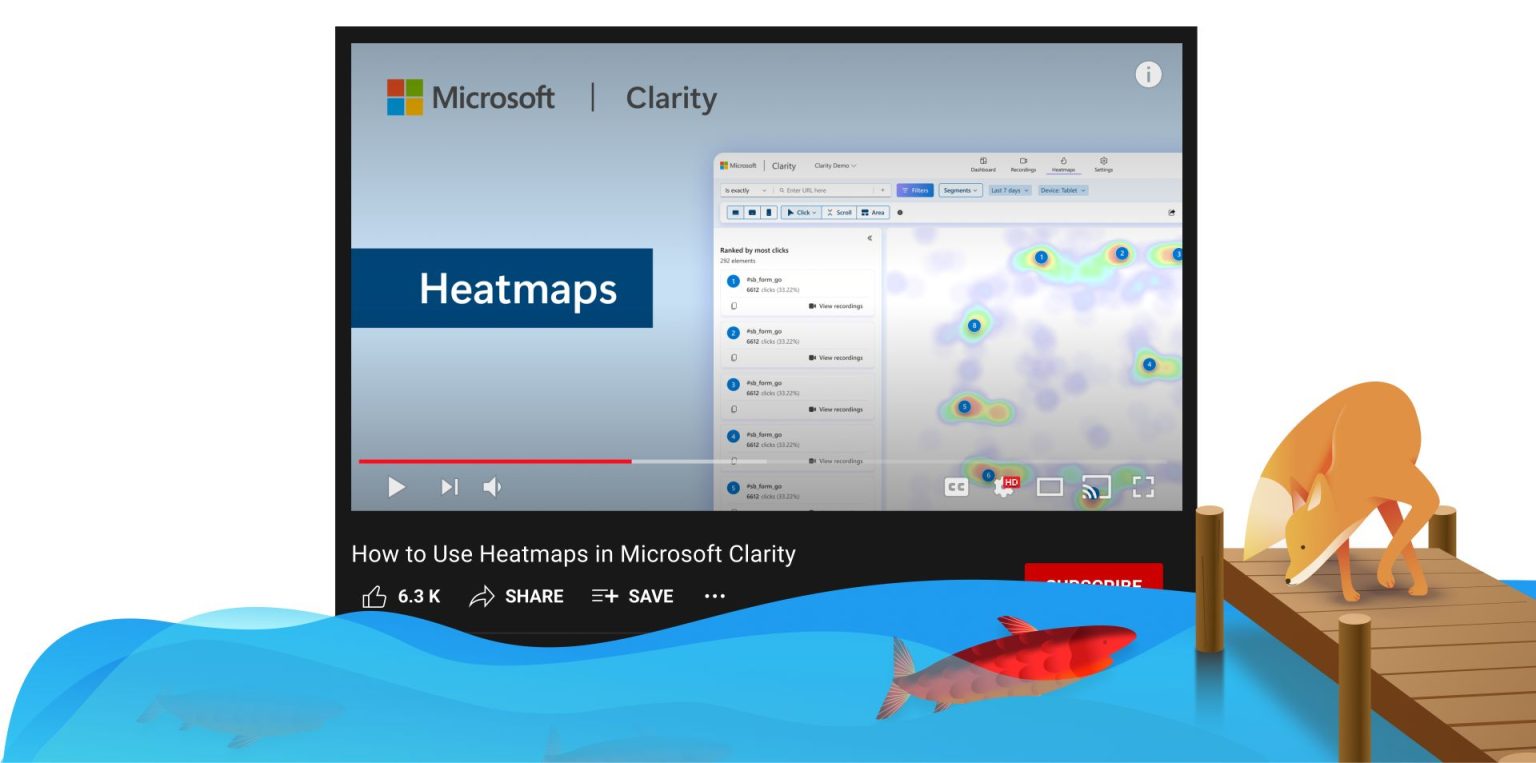
For more information on optimization using Heatmaps watch the video below:
Don’t forget to subscribe to our YouTube channel and follow us on social so you know when our next video will drop!
Enjoy!