
For many Clarity users, understanding where their traffic comes from is just as important as knowing what those users do on-site. Until now, Clarity’s dashboard cards have shown only country-level data without the data to drive local-level decisions.
That’s changing. By bringing City and State metrics directly into Clarity dashboard cards, we’re making it easier than ever to spot patterns, uncover opportunities, and connect user behavior to the places your business serves.
Wait, Doesn’t Clarity Already Show City and State?
Yes and no.
While Country, State, and City data are available in the Filters panel, only Country data has been visible on the dashboard card. And although City can be selected under the drop-down menu in Filters, the option wasn’t always easy to spot. For example, one user said, “Oh, I never noticed that in the Filters. It would be helpful to see it on the dashboard where I access things more frequently.”
This lack of visibility has made adding city data to the dashboard one of our most requested features. One customer put it simply: “The Dashboard should have options to show more detailed geographical statistics than just countries. Most of my use cases with Clarity are for local business.”
Unlock Deeper Insights with City and State Data
With City and State metrics now in the Clarity dashboard cards, it’s easier than ever to spot patterns, uncover opportunities, and connect user behavior to the places your business serves.
1. More Granular Traffic Analysis
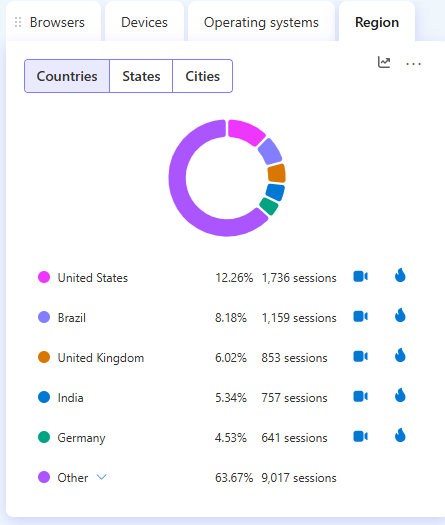
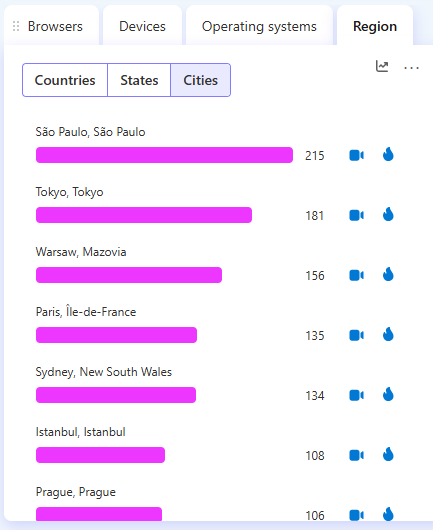
With City and State now visible on dashboard cards, you’ll no longer need to dig into filters to understand where traffic is concentrated. Instead of seeing only “United States,” you’ll be able to compare New York vs. Chicago, or California vs. Texas, at a glance.
This makes it easier to:
- Spot high-performing regions.
- Identify areas with untapped potential.
- See how user engagement differs across locations.
2. Enabling Targeted Audience Analytics
For businesses with regional operations, these new metrics unlock a clearer picture of local audiences. Whether you’re running ad campaigns, tracking store performance, or testing outreach strategies, city-level visibility helps you tie results back to specific markets.
As one user explained: “I need to know the number of accesses by city, so I can know which means of communication allow me to reach different points in the country.”
With this update, those insights are no longer buried—they’re front and center.
Conclusion
City and State metrics on dashboard cards give you the local insights you’ve been asking for—right where you need them. Whether you’re tracking the impact of a regional ad campaign, comparing performance across cities, or simply keeping an eye on your top markets, you’ll now get a sharper view without leaving the dashboard.
Log in to Clarity today to explore your new city and state insights—and start uncovering the stories behind your traffic.