Microsoft Clarity has come a long way from being an internal tool to understand user behavior on Bing.com to a market leading behavioral analytics platform used by millions of sites and mobile apps worldwide. And now, as Clarity celebrates its fifth anniversary, it’s preparing for an even bigger shift towards an AI-powered, agentic web.
In this post, we’re celebrating Clarity’s journey so far, sharing a short video from the team, and highlighting five features that defined our evolution.
5 Years of Clarity — Stories from the Team Who Built It
To mark this milestone, the Clarity team took time to reflect on the journey so far. Watch the video below for a peek behind the scenes at the people, moments, and ideas that shaped Clarity.
5 Features That Defined Clarity’s Evolution
When Clarity launched in late 2020, its mission was simple: make analytics simple, accessible, and work for everyone.
Instead of drowning you in raw numbers, Clarity provided intuitive visual tools – session replays to watch real user journeys, heatmaps to see aggregate click & scroll behavior, and behavioral metrics (like “rage clicks” when a user furiously clicks a broken element) – all with a super easy setup. You just drop a script on your site, and data starts flowing within minutes. No limits on traffic or sites meant even a tiny blog or a huge fortune 500 site could use Clarity without worrying about quotas or fees.
Over the next five years, that foundation became the launchpad for something bigger.
Visual Analytics
Since day one, Clarity has provided visual analytics tools that help you bring your user data to life, turning clicks, scrolls, and session behavior into insights you can act on. Let’s take a look at how visual analysis worked when Clarity first launched, and how it’s evolved since.
Then (2020)
Session Recordings let teams go beyond numbers to see how people actually used their sites. Users could watch anonymized sessions, identify pain points like rage clicks, and explore dynamic elements such as dropdowns and pop-ups. Filtering and segmenting sessions helped focus on specific scenarios, and sharing recordings was easy, but finding the most insightful moments could require time and manual scrubbing.
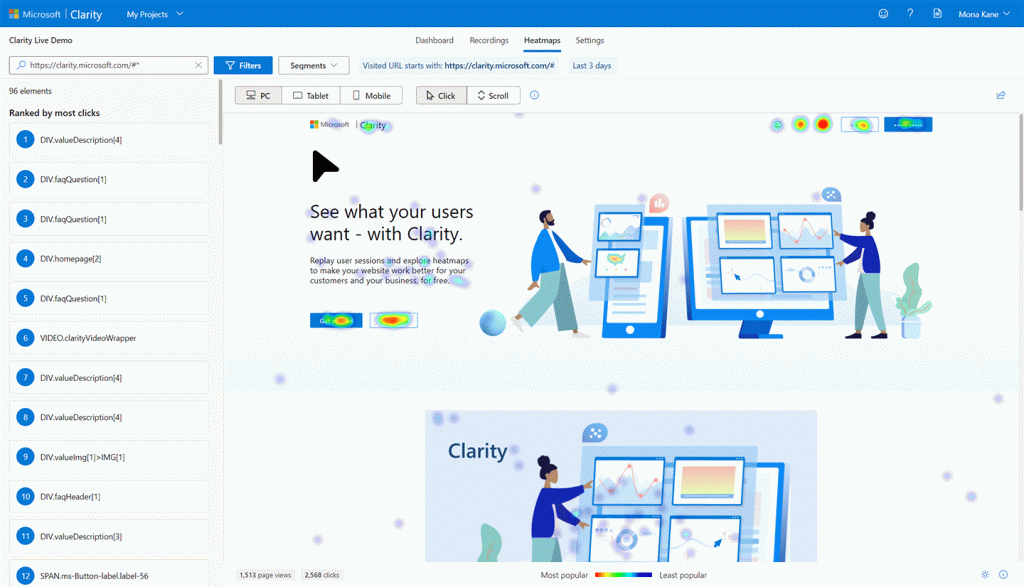
Similarly, Heatmaps provided an instant view of engagement on a page. Click and scroll data highlighted where users interacted most, while element-level metrics and segmentation allowed comparisons across traffic sources, devices, and browsers. Sharing insights was simple, but analysis remained largely manual.
Now (2025)
Session Recordings have evolved into a powerful, AI-assisted tool. Teams can still watch live or past sessions, or they can use the Highlights feature to automatically surface key interactions — taps, clicks, form inputs, and other smart UI moments — in short, social-style clips. Copilot summaries generate AI-driven takeaways for up to 250 recordings at once, while annotations and Notes make collaboration seamless.
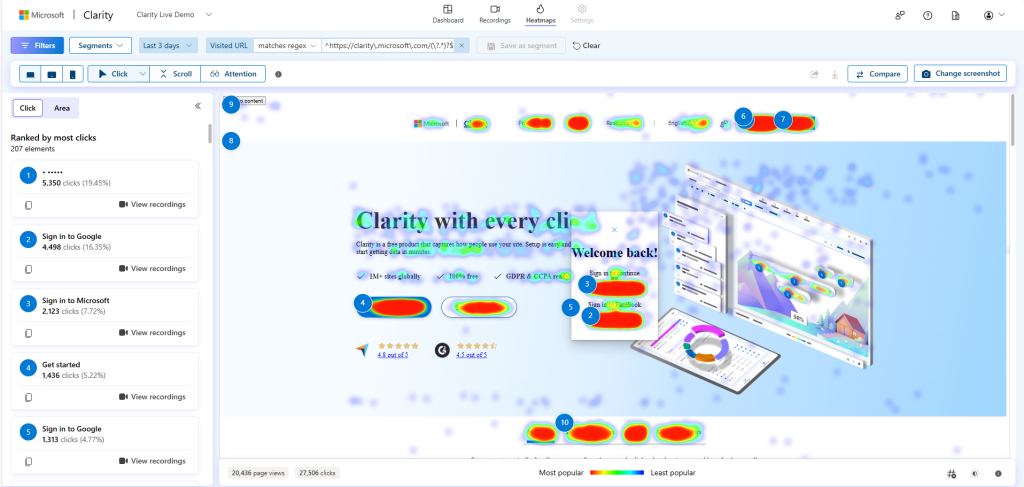
Clarity Heatmaps are richer than ever. In addition to click and scroll data, teams can view area heatmaps, conversion heatmaps (Shopify), and attention maps to understand where visitors focus their time. They can also compare page states, analyze segments, track A/B tests, and download or share heatmaps with ease — all across web and mobile.
Together, Session Recordings and Heatmaps turn raw behavior into actionable insights. Highlights, AI summaries, and advanced segmentation save time, uncover critical moments, and help teams move faster while making better decisions.
Mobile Analytics
Then (2020)
In 2020, Clarity was focused exclusively on web analytics. Teams could analyze websites with heatmaps, session recordings, and behavioral metrics, but mobile apps were not supported. This left a gap for organizations needing a unified view of user behavior across devices.
Now (2025)
In April 2023, responding to popular demand, we introduced Clarity for Mobile Apps, expanding Clarity beyond the browser. Using a lightweight SDK for iOS and Android, Clarity can now capture user sessions inside mobile apps with the same depth as web, tracking tap heatmaps, in-app session replays, and crash analytics.
Whether you’re analyzing a website or a native app, Clarity provides a unified view of user behavior. This expansion to mobile has been a hit, with over 10,000+ apps depending on Microsoft Clarity every day to provide insights and drive improvements.
Data Retrieval & Insight Generation
Then (2020)
Initially, the primary method for retrieving data from Clarity was exporting a CSV or using the Clarity API to pull data into a different application. And while Clarity’s heatmap, recording, filtering, and segmentation features helped customers analyze their data, customers still had to generate insights and recommend changes themselves.
Now (2025)
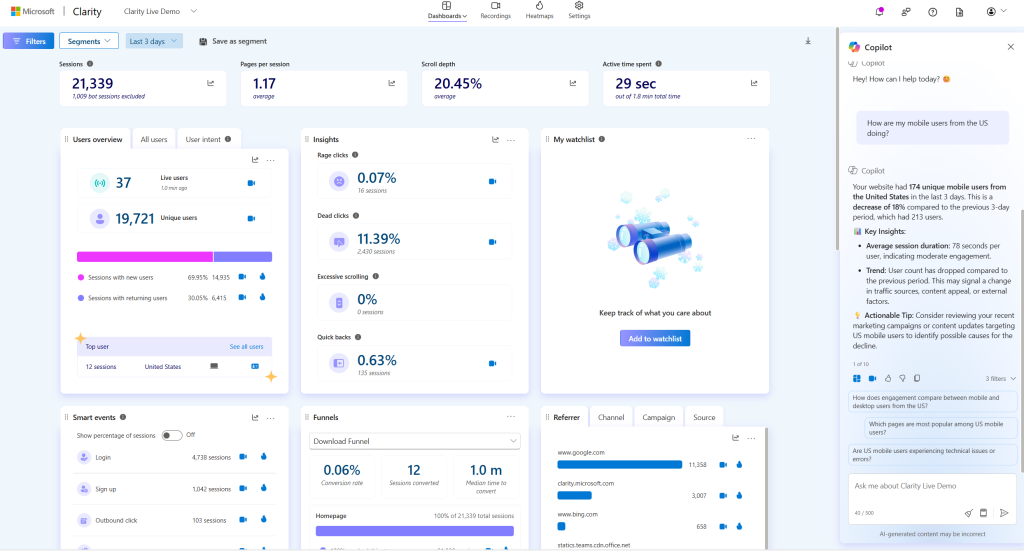
To streamline these workflows, we built Copilot into Clarity, leveraging state of the art LLMs to make analytics even easier. Copilot in Clarity lets you ask questions in plain English and get instant insights from your dashboard data. It can generate summaries of session recordings or heatmaps.
Essentially, Clarity brought the same tech that powers ChatGPT to your analytics, generating over a million insights per month. For example, instead of manually sifting through dozens of replays, you can just ask, “what were the key issues users faced on the sign-up page today?” and get a concise summary. This AI integration makes Clarity even more approachable for non-analysts, turning complex data into simple conversational answers. And yes, Copilot works for mobile app projects too – we rolled out Copilot for Clarity SDK in mid-2024, so app teams can enjoy AI-generated session insights just like web teams.
Clarity is also using AI to streamline the way customers export their data. Copilot inside Clarity lets you export data, generate summaries, and create reports directly from your dashboard using natural language prompts. No complex queries or manual aggregation required. For more advanced workflows, you can set up an MCP server (Model Context Protocol), connecting Clarity to tools like Cursor, Claude, Visual Studio Code, or other MCP-compatible clients. This setup allows you to query analytics data, retrieve session recordings, and generate automated reports, PDFs, or visualizations on-demand.
The Dashboard
Then (2020)
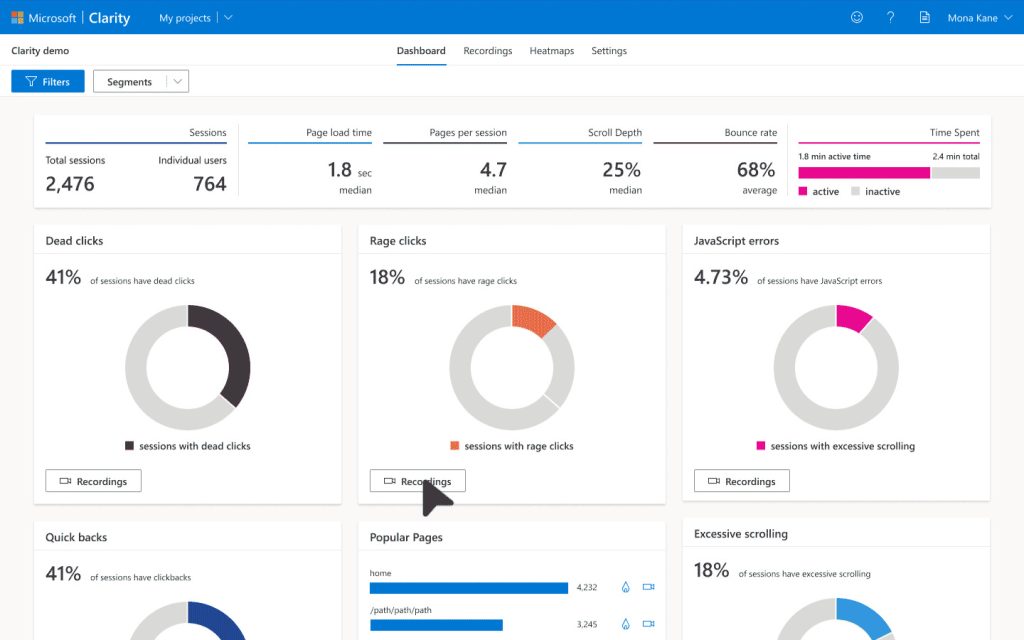
When Clarity launched, the dashboard was your window into user behavior: a simple, functional view of key metrics that laid the foundation for everything to come.
Many key metrics and cards were already in place, such as rage and dead clicks, sessions, scroll depth, JavaScript errors, and quick backs.
From a design perspective, the earlier Clarity dashboard used a grid-based layout with each metric isolated in its own card. The design was driven by donut charts with thin borders, neutral grays, and a single accent color per card.
Now (2025)
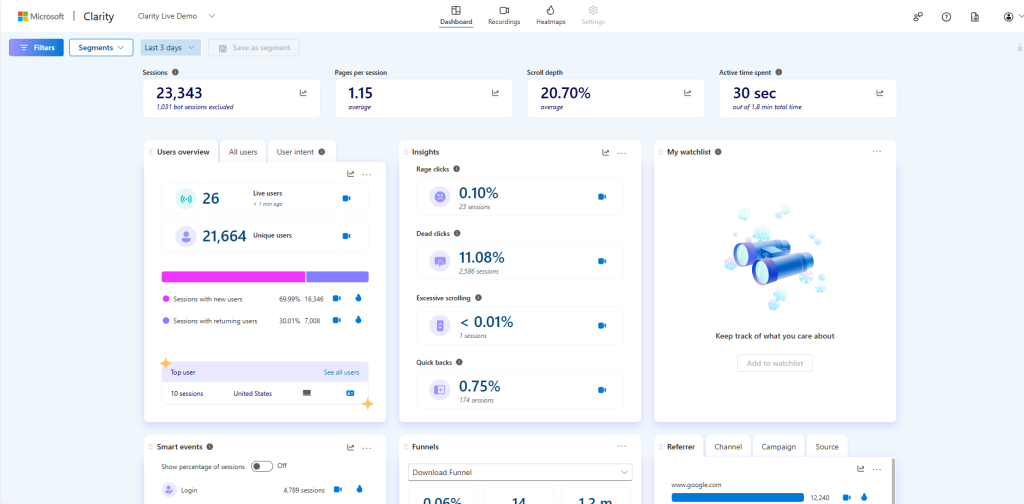
The dashboard has grown in depth, flexibility, and visual distinctness. Cards have tactile borders, richer color, and more iconography. Baseline metrics are consolidated into a single Insights card, making room for newer and deeper cards like:
- My watchlist: tracks the metrics you care about most
- Page performance: measures your pages against key metrics like Largest Contentful Paint and Cumulative Layout Shift
- Smart events: Smart events capture specific user interactions on your site by combining a variety of signals that provide simple and intuitive user actions that occur during a session.
- Funnels: Funnels are an ordered group of user actions, providing a clear view of user progression through each step of the flow.
- AI Channel Groups: tracks two dedicated channel groups (AI platform and paid AI platform), so you can spot, segment, and act on AI-driven visitors with confidence.
Additionally, all dashboard cards have been given more dimension with the Trends feature, providing line graphs that make it easier than ever to visualize trends over time. Cards are also more customizable; you can hide or rearrange them to suit your exact needs.
Integrations
Then (2020)
With a solid dashboard in place, the next step was connecting Clarity to the broader tools teams rely on.
Within the first year, Clarity had a number of integrations for installing it on your website, including Adobe Tag Manager, Google Tag Manager, Joomla, Squarespace, Unbounce, Weebly, and WordPress.
Clarity was also operable with ecommerce platforms like WooCommerce and Shopify.
By this point, we’d also set up integrations with other analytics and A/B testing platforms, including Google Analytics, AB Tasty. Shortly after, we also expanded our integrations list to include platforms like Webflow, SEOPress, Elevar, and AIOSEO.
Now (2025)
Over the years, we’ve kept in mind that Clarity is part of a larger workflow our customers use to drive the web and app businesses. As such, we’ve continued to invest in making partnerships and integrations with products and services that bring you more value.
During this time, we expanded our integrations for installing Clarity in third-party platforms, with new introductions such as SharePoint, Softr, and Webflow.
We’ve also made it possible for users of behavioral analytics platforms like Firebase, Sentry, Amplitude, Mixpanel, and UserFeedback to supplement their existing data with Clarity session recordings.
Additionally, you can now unlock insights on the performance of your Microsoft and Google Ads campaigns, watch session recordings of your HubSpot Contacts, and even automate your Clarity workflow with Zapier.
Conclusion
Five years later, Clarity’s mission hasn’t changed, but its capabilities have grown far beyond what we imagined.
Clarity’s core ethos is still to keep it simple, keep it insightful, and keep it actionable.
Now, standing at the end of 2025, Clarity provides an analytics experience that’s powerful yet playful (Have you met Bruno? 😊) – one where a product manager can watch users navigate a new feature, a marketer can see exactly where landing page visitors click, a UX designer can uncover friction points via rage clicks, a developer can discover bugs that drive customers away, and anyone can get AI to do the heavy-lifting of analysis.
We’re proud of how far Clarity has come. But we’re even more excited about what’s next. Because the very nature of “a website visit” is changing, and Clarity is gearing up for that future.