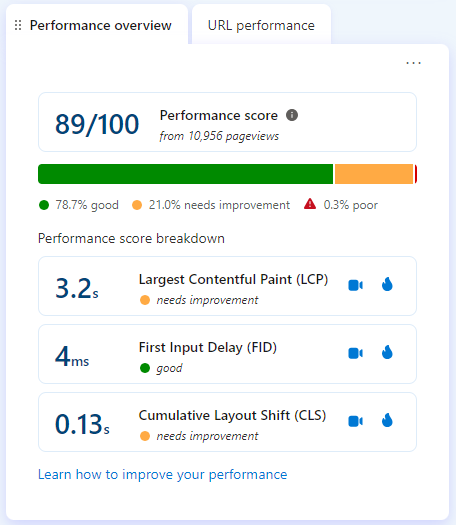
Hey there, website wizards! Ever wondered how to make your website not just good, but great? It’s all about what gives your visitors a smooth, speedy, and stable experience. And guess what? There’s a handy tool for that – the Performance widget! It’s like a health check-up for your website, focusing on what we call the core web vitals. Let’s dive in and make sense of all this, shall we?
What’s the Big Deal with Core Web Vitals?
Imagine visiting a website and waiting forever for it to load, or trying to click something and nothing happens, or even worse, everything jumps around as you’re reading. Annoying, right? That’s where core web vitals come into play. They’re the superheroes of website performance, ensuring everything loads fast, responds quickly, and stays put as it should. Here’s the trio that saves the day:
- Largest Contentful Paint (LCP): This is all about speed. It measures how quickly the main stuff on your page loads. The goal? To have everything pop up in a jiffy, ideally in 2.5 seconds or less from when the page starts loading.
- First Input Delay (FID): Ever talked to someone who takes ages to reply? Frustrating! FID is the web equivalent, measuring the time from when you first interact with a site to when it actually responds. We’re aiming for a quick comeback, 100 milliseconds or less.
- Cumulative Layout Shift (CLS): Ever read a page and suddenly the text moves, and you lose your spot? That’s what CLS measures – the stability of your page’s layout. We want everything to stay put, with minimal shiftiness.
Navigating the Performance Widget
This widget gives you the lowdown on how well your site is doing in the performance department. It’s split into two main parts:
- Performance Overview: Think of this as the highlight reel, showing you the overall score and letting you dive into specific issues with cool tools like recordings and heatmaps.

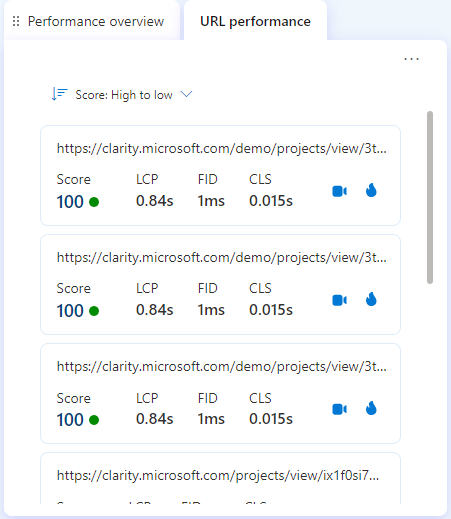
- URL Performance: This is where you get down to the nitty-gritty, analyzing each page to see where you can make improvements. Sort by score, LCP, FID, or CLS, and use those recordings and heatmaps to get a clearer picture.

And hey, you can even set your favorite tab as the default. Just a little customization to make your life easier.
Fixing the Glitches
So, you’ve got the scores, but what if they’re not what you hoped for? No worries, we’ve got fixes!
- LCP Issues? Might be those hefty images or some sluggish server response. Try optimizing images or giving your server a boost.
- FID Frustrations? There is probably some heavy JavaScript at play. Look into loading it differently or cutting down on the bulk.
- CLS Concerns? This usually happens when things load unexpectedly. Make sure images and videos have dimensions set, and keep ads and embeds in their place.
Putting It All Together
Now that you’ve got the lowdown, use those insights! Watch how users interact with your site, especially where there are hiccups. See a high LCP? Check out how visitors react. Frustrated clicks could mean FID issues, and unexpected layout shifts point to CLS problems. Use what you learn to make your site better and keep checking back with the widget to see your progress.
