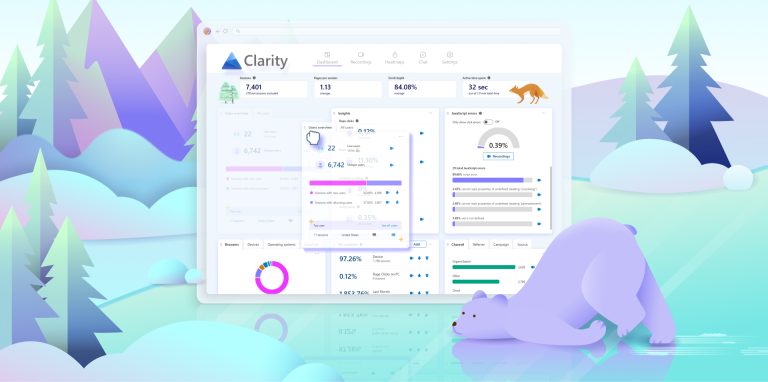
The Clarity Dashboard is Now Customizable!
We are excited to share the latest Microsoft Clarity update with you all. We’ve been listening to your feedback and
We are excited to share the latest Microsoft Clarity update with you all. We’ve been listening to your feedback and

My name is Alex Griffis, and I’m the President of Overfuel, a website and digital retailing platform servicing automotive dealerships

In the field of data analytics, obtaining insights and facilitating strategic decision-making depend on the integration of many tools and

This year at Clarity has been a thrilling journey, marked by significant transformations in our design and features. These enhancements