Spark Shipping

Spark Shipping

How Spark Shipping increased inbound leads by 30%

What is Spark Shipping?

Spark Shipping was initially created to address the needs of their network of e-commerce sites, which started back in 2011.

With the rapid growth of their business, they needed to automate the core processes, so they set out to build a solution. After building the internal eCommerce automation platform, they immediately saw the value it brought to the business. They realized this was too good to keep to themselves and decided to share it with others experiencing the same problems.

That is how Spark Shipping was born in 2013! Now, more than a decade later, they have helped thousands of e-commerce site owners to automate their businesses and grow their profits.

Charles Palleschi, CEO of Spark Shipping

The Challenge

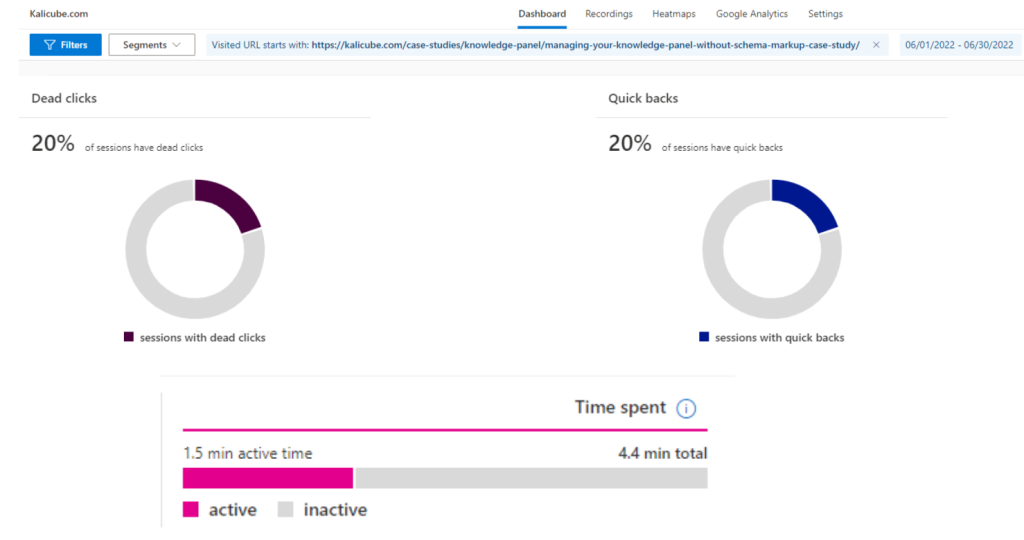
With new features coming all the time for Spark Shipping, they needed away to understand the user’s journey with every new feature launch.

Using the insights gained from Clarity, they were able to redesign menus and change where in the app Spark Shipping placed links to specific features, which dramatically increased user engagement within those features. 

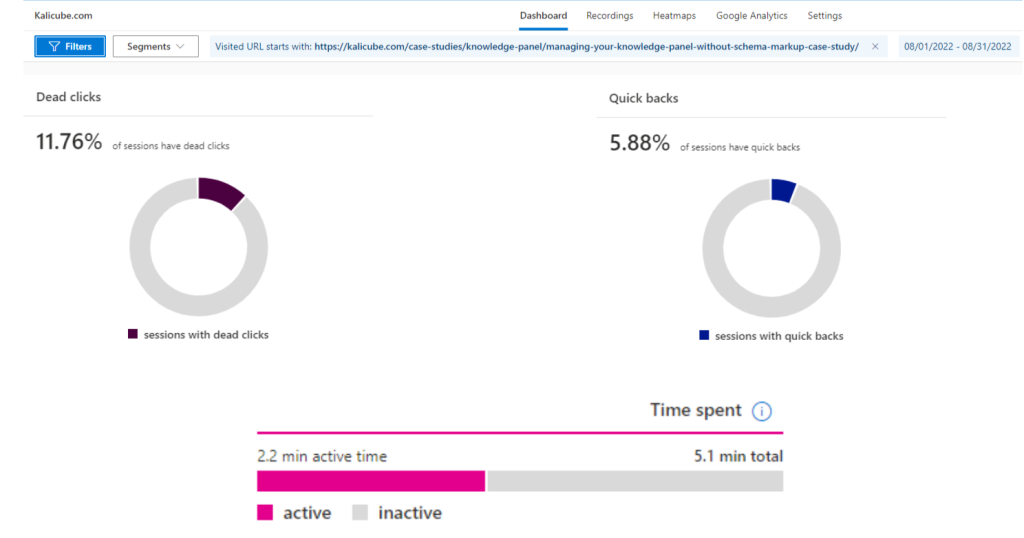
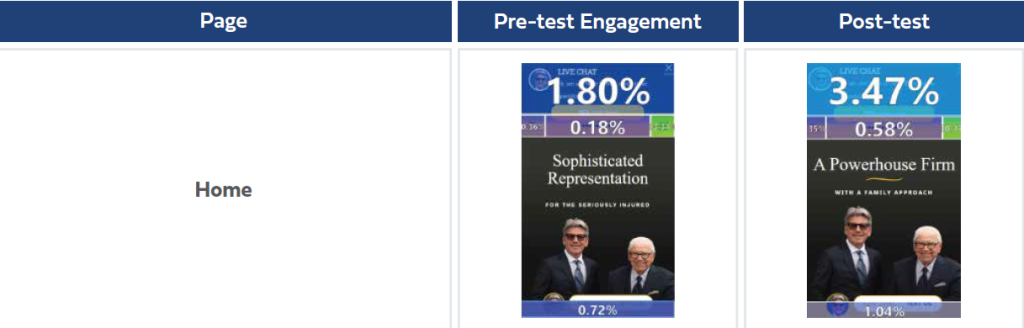
From a sales perspective, they also wanted to increase inbound leads. To do this, they needed to understand what users were focusing on and where they clicked on the pages.

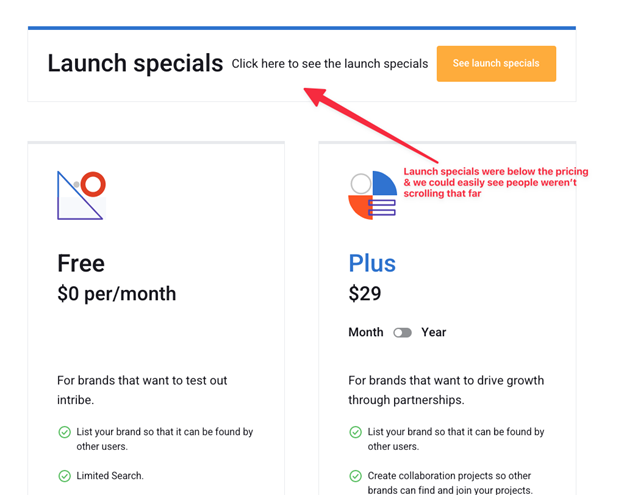
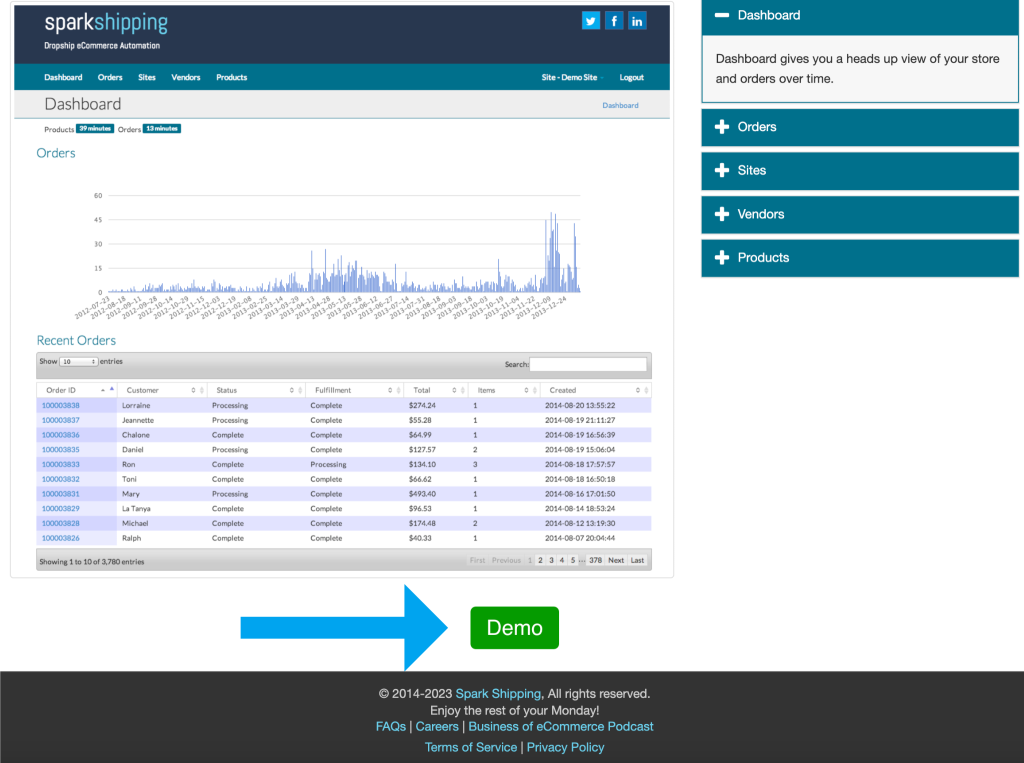
For example, they had landing pages where “Get a Demo” button was in the middle of the page, but found users typically read to the bottom of the page where no CTA button was.

Clarity helped Spark Shipping understand this behavior and prompted them to add an additional CTAs (Call-to-Action) to the bottom of the page, which has increased the inbound leads by almost 30%.

What did Spark Shipping use before Clarity?

Spark Shipping used Hotjar, but soon found that the cost became prohibitive for the amount of data needed. They couldn’t get sufficient user data to understand the behavior of our users due to cost constraints, but with Clarity, Spark Shipping has access to all the data they need.

Learn how your customers navigate your site!

Through recordings, heatmaps and much more!

The Solution

Clarity allowed for access to complete data for all their users, enabling them to get full insight into their user’s journey and behavior within the Spark Shipping application. This has allowed them to continuously improve their user interface to ensure that users can take advantage of all of the benefits Spark Shipping offers them.

Session recordings and heatmaps have both been super helpful in the success for Spark Shipping. The session recordings allowed them to understand how users interact with the site from the first moment they land on a page, while heatmaps helped pinpoint sections of the site that visitors found confusing.

Using heatmaps, Spark Shipping found cases where users were expecting elements to be clickable that were plain text. Simply knowing this has allowed for adding links to pages to increase CTR and user experience.

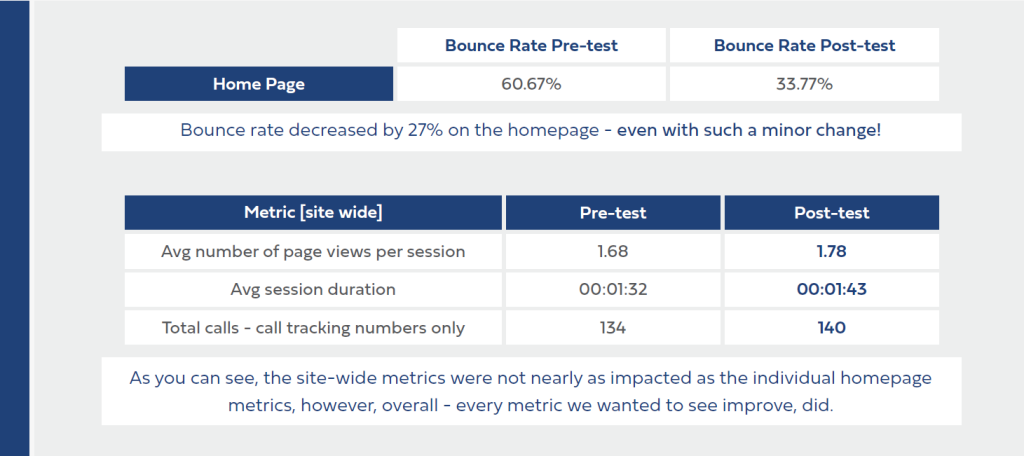
Using Session recordings, they found landing pages where visitors were expecting a CTA but did not find one. This caused them to hit the back button instead of progressing. After using Clarity, Spark Shipping updated these pages to include a CTA right where visitors expected it, which has increased leads and reduced the bounce rate.

Learnings

By choosing Clarity as their behavioral analytics tool, Spark Shipping was able to get the full picture of how their users interacted with their website. With no data limitations or pricing tiers they increased their inbound leads by 30% with session recordings and heatmaps, by visualizing pain points for their customers within their UX design.

“Clarity is an indispensable tool for our business, as it allows us to understand exactly what our users are doing when using our software. This has enabled us to continuously improve the user experience for our clients, making sure that they can get the full benefit of Spark Shipping.”

Charles Palleschi


Softr.io

Softr.io

How Softr.io uses Microsoft Clarity for a weekly meeting to improve their customer journey

What is Softr.io?

Softr.io enables anyone to create applications for their business. With a low learning curve, creating applications with Sofrt.io was designed to be as easy as putting a PowerPoint together. You can create a variety of applications, such as client portals, internal tools, marketplaces, websites, landing pages, and more! Did we mention no coding is necessary? That’s the magic of Softr.io.

Mario Araujo Head of Growth at Softr.io (pictured below) loves using Clarity so much, he made a weekly meeting out of watching session recordings. This has been a great resource for the Softr.io team to improve the customer journey.

The Problem

Softr.io ran into an issue with matching the right journey for a specific customer. The needs of one person might not have aligned with another. The most common difference was between a small business team developing apps for their customers and a large business needing to use them for internal usage. Having two different use cases meant needing two different customer journeys.

Before Clarity, it was like flying blind with no instruments to guide Softr.io in the right direction. With Clarity, it’s like sitting right next to your customer and watching how they interact with the website. This gave Softr.io a better understanding of how their customers interacted with their website and what journey they needed to convert.

The Solution

Softr.io was able to segment its visitors within Clarity’s Dashboard to identify which journeys needed to be changed to adapt to the appropriate visitor.

Looking at Clarity session recordings turned into a weekly meeting at Softr.io. Every week the team gathered together and watched anywhere from 5-10 session recordings that were jam-packed with great learnings. From these weekly meetings, the Softr.io team has been able to better serve their customers by understanding the journey they need to be on, instead of what they thought they should be on.

Improvements

After adding Clarity to their website, Softr.io saw a tremendous improvement in their customer’s journey. It didn’t happen overnight, but by keeping consistent with weekly meetings and updates to the website, they improved the conversion rate. They started with around a 45% conversion rate from customer sign-up to onboarding and now boasts a 90% conversion rate.

“Microsoft Clarity has become a critical tool in our toolbox. It’s simple, easy to use, and provides great insights so we can continuously improve”

Softr.io
Kalicube

Kalicube

How Kalicube Increased Active Time on Page +47%

Using Microsoft Clarity, Kalicube received insights into how its audience interacts with long-form content. An analysis of the case studies section of the Kalicube.com site allowed for the optimization of four critical metrics and ultimately improving their bottom line by driving more qualified leads:

  • Time on page +16%
  • Active time on page +47%
  • Quick backs -71%
  • Dead Clicks -41%

What is Kalicube?

Kalicube is a digital marketing agency founded in 2015 to pioneer the concept of Brand SERP optimization and Knowledge Panel management. Jason Barnard (pictured below) is the founder of Kalicube, and has more than two decades of experience in digital marketing.

He started in the year Google was incorporated with a website for children based on the characters Boowa & Kwala, which he built up to become one of the 10,000 most visited sites in the world.founded in 2015 to pioneer the concept of Brand SERP optimization and Knowledge Panel management.

Jason Barnard (pictured below) is the founder of Kalicube, and has more than two decades of experience in digital marketing. He started in the year Google was incorporated with a website for children based on the characters Boowa & Kwala, which he built up to become one of the 10,000 most visited sites in the world.

Kalicube Wanted to Increase User Engagement and On-Page Time

Kalicube provides content that is truly helpful to their audience but struggled to understand why visitors weren’t engaging. Like most sites, Kalicube.com uses Google Analytics, which shows bounce rate and session duration….But never told them how the audience interacted with the content. 

Kalicube.com wanted to make their content more “sticky”, which means ensuring that the content is present in a way that helps the audience consume it and make the best use of it. That is where Microsoft Clarity was a HUGE help.

Getting insights into how the audience interacts with the pages is a massive help in improving the user experience. But first, they needed to determine which section of the website to focus on first.

The Kalicube Case Study Section Is the Most Popular 

A quick glance at the Microsoft Clarity dashboard showed that the case studies section is the most popular. The next step was to look at the recordings and heatmaps to see how visitors behave on these important pages. This allowed for optimization to increase engagement and identify topics that drive engagement instead of just traffic.

The huge question that Kalicube wanted to answer with Microsoft Clarity is, “how can we better engage our core audience with a page design that better retains their attention”

Adding the Table of Contents

Without a table of contents, the user was immediately presented with the introduction. Clarity showed that they tended to scroll, skim the article, and leave the page.

Kalicube added a table of contents at the top of the page. After analyzing the site visitors’ behavior, they understood that they were incredibly important to their users.

When comparing the before and after on Microsoft Clarity, it became clear that a table of contents helped the users see which parts of the case study interest them at a glance. The Kalicube team could clearly see that the Table of Contents reduced quick backs, improved readability, increased active time on the page, and generally kept the core audience significantly more engaged.

Turning Dead Clicks Into Pull Quotes

“Dead clicks” is a term Kalicube hadn’t heard of before. Simply put, they are clicks on a page that do not initiate a change or action. People often make “dead clicks” when misled into thinking that an element on the page will trigger a change or action. That wasn’t the issue here, however.

What Kalicube saw in their case studies was that site visitors clicked and selected the text they were reading. It might be surprising that people do this (we certainly didn’t expect this behavior), but it showed which parts they find really insightful. 

This gave Kalicube the idea to extract these dead-click selected texts as pull quotes within the content, making it easier for time-sensitive visitors to get the message:

And then took that a step further and made shareable visuals, which led to a noticeable uptick in social media activity around the case studies:

Positive Results After Two Months

The data received from Clarity in June shows that visitors on the site spend a total of 1.5 minutes actively engaging with the case studies and 4.4 minutes on the page… and that there had been 20% dead clicks and 20% quick backs (where site visitor immediately returns to the previous page after seeing our case study page).

Kalicube made several iterations of changes using the data from Microsoft Clarity to guide them. The results were incredibly positive. The time spent on the page increased from 4.4 minutes to 5.1 minutes, but more importantly, the active time increased by almost 50%. 

Even better, quick backs dropped four-fold, suggesting that the table of contents helped the core audience understand what the case study offers. 

Dead clicks dropped almost 50%. Using pull-quotes made the content more easily digestible by proactively highlighting the essential parts.

User Engagement isn’t a Vanity Metric. Far From it.

You are driving your bottom line when you can help your core audience better engage with your bottom-of-funnel content. At Kalicube, they saw that the improved user experience had significantly increased the number of qualified leads they received from the case study pages. Not only did they have more inquiries for their services, but they also saw that the people who contacted them better understood what they could offer. 

Increasing bottom-of-funnel audience engagement and focus has been a HUGE win for Kalicube.

The actual changes we needed to make to get that “win” seem oh-so-obvious now. Without Microsoft Clarity, we never would have known.

Microsoft Clarity provided the data that allowed us to vastly improve the user experience for our core audience, which has directly improved the bottom line of Kalicube’s business. The detailed charts have helped us to better visualise the positive impact, report on the improvements and justify the investment in enhancing this part of the site.

Kalicube

intribe

intribe

How partnership marketing platform intribe saved

money, improved data retention, and increased

conversions by 62% 

Their Story

Founder of intribe, Sven Radavics (pictured left), started the company as a side hustle solving his own problem of finding brand partnerships for another startup he was working with. As well as running worldwide sales for them, he was tasked with building a co-marketing program and realized it was another full-time job. He figured there must be a platform for this, but couldn’t find one, so he built one. 

You can think of intribe a MarTech SaaS as ‘Tinder for brand partnerships and collaborations.’ It solves the discovery and connection piece and enablement of all types of partnership campaigns.  From content and event partnerships to cause marketing and co-branding partnerships. 

The Challenge

The organic traffic for intribe was growing quickly, but conversions weren’t scaling with the traffic. They saw a consistent drop in their conversion rate, even though people were engaged on their website. Only the most committed of prospects were signing up because the funnel was difficult for the user to flow through.  

Luckily Clarity was there to help!

Learn how your customers navigate your site!

Through recordings, heatmaps and much more!

THE SOLUTION

Sven (founder of intribe) has been clear on the need for a visual behavior tool. He wouldn’t try and build an app or run a website without one.

They originally used Hotjar’s free version but kept running into limits and restrictions with their features. They were about to upgrade but luckily discovered Microsoft Clarity through a friend’s recommendation. Microsoft Clarity had nearly every feature Hotjar offered with no cost, limits, or restrictions.

With Clarity, intribe could identify user confusion and see where they were dropping out of the funnel.  They even saw that users kept clicking on certain texts they thought would be a button or link with Clarity’s dead click feature.

They utilized the session recording feature to see exactly how a user behaved, compared to just the final data collected.  This was so powerful for them to see where the users ran into pain points on their website, which allowed intribe to make the necessary changes.

The biggest fix was moving their Call-To-Action above the fold, which led to a 300% increase in clicks on their CTA button.

Learnings

By watching their user’s behavior with session recordings, intribe was able to learn more about their customers than they did previously by interviewing or surveying them to uncover and solve UX issues. You save more time and allocate fewer resources to finding the correct solutions. With Clarity, you can watch up to 100,000 session recordings daily and filter the sessions which are critical to your site performance.

Testimonial Quote

“It’s hard to believe that Clarity is a free forever tool.  The power of the session recordings is a game changer.  I wouldn’t publish a website without it.” 

Sven Radavics

Protected: Augmeta

Protected: Augmeta

This content is password-protected. To view it, please enter the password below.

Consultwebs

Consultwebs

Custom Online Marketing for Law Firms to Crush their Competition

“How lawyer SEO agency, Consultwebs, leveraged Microsoft Clarity and Google Optimize to lower their client’s homepage bounce rate by 27%”

What is Consultwebs?

Consultwebs is a Digital Marketing Agency that performs custom online marketing for law firms. They have over 20 years of experience helping law firm clients dominate search rankings, rack up top-quality leads, sign new cases, and reap the benefits of long-term strategies for online success.

Cheyenne Ferguson (below), Digital Marketing Manager of Consultwebs, has been an integral in leading her team to help her clients crush their competitors.

Microsoft Clarity helped her crack a recent issue for one of her clients (https://finzfirm.com) who struggled with website performance.

The Problem

Cheyenne noticed that the bounce rate was much higher on mobile than any of the other platforms. Consultwebs conducted an A/B test to determine if the logo was too large and impeded the UX (user experience) design.  

With Clarity, Consultwebs also identified another low-performing area in the sticky bar pop-up that prompted users to call. This turned out to be more of a UX blunder than a wonder. 

Learn how your customers navigate your site!

Through recordings, heatmaps and much more!

THE RESULTS

A two-month testing period took place where Consultwebs found that the UX design with the logo had caused abnormally high bounce rates on Finzfirm.com. The home page bounce rates dropped 27% and site wide metrics increased slightly all around from this minor change (Pictured below).

Clarity offers an inside look of how customer’s react when they visit your website. With session recordings, heatmaps, and data insights you can quickly pinpoint pain points and areas of opportunity. These tools prompted Cheyenne and the Consultweb team to test out a bolder more “powerful” copy, which lead to an increase of over 1.5% in engagement rate.

Consultwebs found Microsoft Clarity to be an easy yet effective tool to bring better results to their clients.

Below is a note from the Consultweb team about their experience with Clarity and how they use it regularly.

While we can see how much a user scrolls, and their engagement in the
heatmap tools – Clarity also provides a dashboard that is totally
customizable to any type of segment you want to track, or individual URLs.
The dashboard connects with Google Analytics to provide a more in-depth
look at the behavioral data and provide metrics like dead clicks, rage clicks,
JavaScript errors, and more. While these metrics aren’t necessarily “Google
ranking factors” – Google experts have commented a lot recently about
mobile user experience on site.
Another great thing about Microsoft Clarity is that it doesn’t slow down our
sites either! Utilizing the PageSpeed Insights tool, we can see that mobile
site speed performs around a score of 92 for Finz & Finz, P.C. The
PageSpeed Insights tool also shows the scores from a Core Web Vitals
Assessment – which is also part of measuring that user experience
(according to Google) we were trying to study with this experiment.

Cheyenne Ferguson, Digital Marketing Manager of Consultwebs